Category: Research Library

Free 2023 ASDC Fall Data Conference

  • October 10th, 2023

The Alabama State Data Center (ASDC), housed in the University of Alabama’s Center for Business and Economic Research (CBER) hosted its annual Census data conference on Thursday, November 9, 2022 from 9:00am to 12:30pm CST. The free virtual conference included presentations on the latest updates from the Census Bureau’s 2020 urban-rural classification system; the Population Estimates Program; the Economic Census; and the recently published 2020 Census Demographic and Housing Characteristics file.

Click on the red, bold titles below to view the slides for the presentations. For recordings of the webinars, reach out to Susannah Robichaux, CBER socioeconomic analyst and lead for the ASDC, at scrobichaux@ua.edu.

Alabama State Data Center Fall 2023 Conference
Thursday, November 9, 2022: 9:00am – 12:30pm

Welcome and Introductions | Susannah Robichaux, ASDC Lead / Socioeconomic Analyst, The University of Alabama’s Center for Business and Economic Research; and Devon Reed, Liaison to the State Data Centers and Census Information Centers, Data Users Branch, U.S. Census Bureau.

Population Estimates from the U.S. Census Bureau| Kevin Barragan-Smith, Demographer/Statistician Coordination, Dissemination, and Outreach Branch, Population Division, U.S. Census Bureau. This presentation was an overview of the Census Bureau’s Population Estimates Program (PEP), which produces population and housing estimates for the United States, its states, counties, cities, and towns. It included some background information about how the estimates are made, what estimates are available, and a detailed walkthrough of how to access estimates. It also gave an introduction to the Population Estimates Challenge Program, which allows governmental units to submit requests to revisit that year’s estimate if they suspect there has been a technical error or incorrect input data. Lastly, it covered the national population projections released by the PEP. As a reminder, CBER produces county population projections that are available on our Alabama Demographics page.

2020 Census Data Products and Disclosure Avoidance | Matthew Spense, Senior Advisor for Special Population Statistics and Disclosure Avoidance, Population Division, U.S. Census Bureau. This webinar was an overview of 2020 data collection, data protection (differential privacy), and the data products released including the Apportionment file, Redistricting data; and the Demographic and Housing Characteristics File (DHC).

Economic Census Updates | Adam P. Grundy, Supervisor, Data User and Trade Outreach Branch, Economic Management Division, U.S. Census Bureau. The Economic Census provides the most comprehensive measure of the U.S. economy, producing industry statistics at the national, state, and local levels. Its data products provide the foundation for other key measures of economic performance. This information is used by businesses, policy makers, local governments, communities, individuals, students, and researchers for economic development, business decisions, strategic planning, and data reports. This presentation will be an overview of the program and the available data products. It also had a detailed walkthrough of how to use the Census Business Builder 5.3.

2020 Urban/Rural & Geography Updates | Byron White, Geographer, Address and Spatial Analysis Branch, Geography Division, U.S. Census Bureau. This presentation offered an overview of the Census Bureau’s urban area criteria; the key changes for the 2020 Census Urban Areas; key 2020 Census Urban Area trends; and what is next for urban areas.

Examining County Unemployment during COVID-19

  • September 1st, 2020

Authored by: Nyesha C. Black, Ph.D.

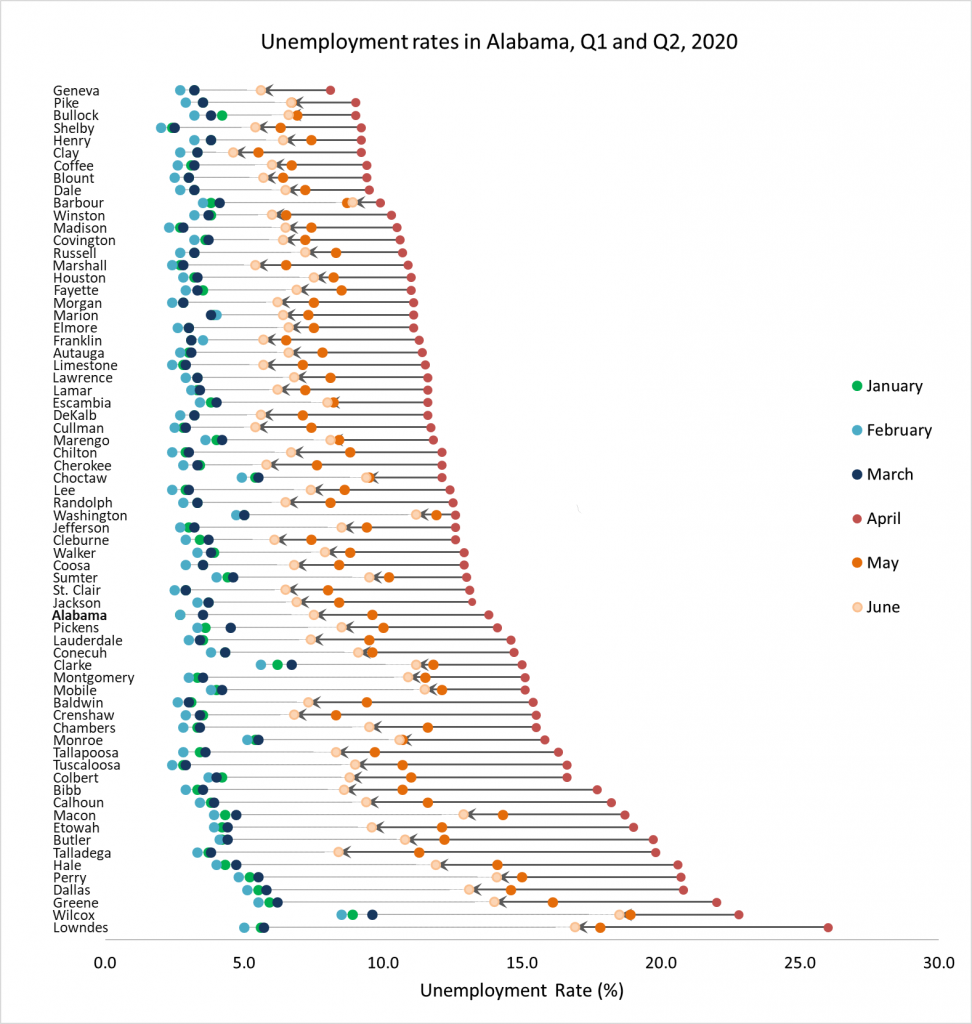
Alabama’s unemployment rate increased by nearly 300% from March to April of this year after stay-at-home orders were implemented to thwart the spread of COVID-19. While this gives us a broad-stroke view of what transpired this spring, it is worth noting that the economic shock of the pandemic affected counties differently. The dramatic variance in unemployment from Q1 to Q2 can be clearly observed in the data visualization below. The graph shows each county’s unemployment rates for January through June as color-coded dots. The unemployment rate peaked in April, among all counties, so those data points were used to sort the counties from lowest peak unemployment rate to the highest.

Scatter plot of unemployment by county for January through June of 2020
Visualization Prepared by The Center for Business and Economic Research at The University of Alabama using data from the Alabama Department of Labor and United State Bureau of Labor Statistics


Even before the pandemic, the unemployment rate varied greatly across the state. For example, the average unemployment rate during Q1 ranged from 2.3% in Shelby County to 9.0% in Wilcox County. However, by Q2, the spread was much more significant. The average unemployment rate ranged from 6.4% in Clay County to 20.2% in Lowndes County. It seems as though the differences in the counties unemployment rates were exacerbated by COVID-19. Several counties in the Black Belt already had higher unemployment rates in Q1 and experienced much higher rates in Q2 than counties with lower unemployment rates in Q1. In April, six counties, all in the Black Belt, had unemployment rates higher than 20%.

In June, unemployment rates rebounded, but the rates were still markedly higher, across all counties, compared to the end of the first quarter. By June, no county had returned to the unemployment rates in Q1, but some counties made better progress than others. For example, Clay County had unemployment rates that were the most comparable to March, but the unemployment rate for the county was still 40% higher in June. In comparison, Montgomery County unemployment rate rebounded the least among all the 67 counties, and had rates that were more than twice as high in June compared to March.

COVID-19 and the Economy

  • March 31st, 2020

In the midst of the uncertainty caused by the COVID-19 pandemic, CBER’s experts are here to offer some insight. Sam Addy, Associate Dean for Economic Development Outreach & Senior Research Economist, and Ahmad Ijaz, CBER’s Executive Director & Director of Economic Forecasting weigh in with what we can expect in our local and national economies in the coming months.

People are at the core of the economy, playing roles on both the demand side as consumers and the supply side as workers, innovators, investors, entrepreneurs, proprietors, providers, etc. As such, the health of people and their educational attainment are key to development. People’s health is crucial because healthy people can learn and contribute, but sickness makes people unable to contribute regardless of how educated and skilled or talented they may be. By presenting a danger to people’s health, the novel coronavirus (COVID-19) pandemic has the potential to cause substantial harm to every local, regional, national, and the global economy.

The proper response to this danger is to use resources to address survival first, recovery next, and development later. It is important to note that pandemics occur within economies and so are not separate from them. As such, the nature of the response determines the resulting state of the economy; a good response will result in a better economy than an abysmal response would. Survival and recovery require significant resources, but are necessary to ensure that when the pandemic is controlled, the essential human capital, physical and natural/environmental capital, and public and private institutions will still be available to enable a renewed focus on development. Fortunately, the United States has the resources (human, financial, institutions, and infrastructure) to work this Survival-Recovery-Development strategy even if controlling the pandemic takes 18 months as some medical experts have predicted. In addition, even if the nation’s wealth falls considerably in the process of confronting the pandemic, the nation will still be very affluent afterward.

United States

COVID-19 will cause all sectors of the economy to experience negative effects during this time, but firms in certain sectors (e.g., health-related, logistics, communications and technology, repurposed manufacturing) could fare better than others. While the direction of effects is clearly that there will be contraction from earlier expectations and forecasts, the magnitude is unknown at this time since the direct health effects are themselves unknown. It will depend greatly on (i) governmental policies and actions that are adopted and implemented at all levels (federal, state, and local) and (ii) how people behave; specifically, how seriously they take and respond to directives and policies. From a resource perspective, the composition, design, and size of the response packages that Congress and the Federal Reserve put in place will be of utmost importance. Response to the pandemic must include a medical component to people and health-related institutions for survival as well as assistance to people, government, businesses and other institutions (both nonprofit and for profit) for survival and economic recovery.

The financial accounts of the United States (FAUS) show that household net worth rose to $113.8 trillion in the fourth quarter of 2019. This is net of $53.9 trillion in domestic nonfinancial debt outstanding ($16.0 trillion household debt, $16.0 trillion nonfinancial business debt, and $21.9 trillion government debt). In 2018, U.S. gross domestic product (GDP) was $20.6 trillion and total employment was about 200.7 million (154.4 million wage and salary employment and 46.4 million proprietors). Personal income was $17.8 trillion, of which wages and salaries totaled $8.9 trillion. State and local governments had total revenue of $3.9 trillion in 2017 with $710 billion coming from federal coffers. COVID-19 will cause severe declines in GDP, personal income, employment, wages and salaries, government revenues, and other relevant economic indicators. The above-mentioned data suggest that survival and recovery for the nation during this pandemic will require injection of about $1 trillion a month, which the FAUS data suggest that the nation can afford.

Alabama

Alabama accounts for 1.1 percent of U.S. GDP and 1.5 percent of the population, which defines a potential range regarding COVID-19 impacts on the state economy relative to national impacts. For example, a $1 trillion national impact could mean an $11 billion to $15 billion impact on Alabama. However, several factors can make the range larger or smaller. These include the nature of the impacts, the behavioral component of the response, and differences in demographics and economic structure. Second quarter Alabama GDP will most likely decline by about 3-4 percent, with employment falling much faster. Any recovery in the third quarter will be quite weak due to supply-side constraints facing Alabama manufacturers and weak consumer demand and business spending. Optimistically, the state economy will be back on a normal path of recovery by the fourth quarter.

Portions of the economy at risk of significant declines include travel and travel-related businesses, food services and eating places, tourism and leisure, support services, auto dealers, gas stations, education, manufacturing firms that rely on exports and/or overseas suppliers for their inputs, and other businesses that depend on consumer and business spending. These firms together employ nearly 1.2 million workers (or about 58 percent) of the total nonfarm employment in the state and their multiplier effects on the rest of the state’s economy could make it difficult for the economy to recover in the third quarter. Furloughs and layoffs will be common. The expected significant declines in economic activity will adversely affect income, sales, lodging, gas, and other tax revenues for both state and local government entities.

Business investment spending has been mostly weak for the last couple of years. COVID-19 effects and the large drop in oil prices will most likely push business spending into much deeper negative territory. Weaker economic growth in the rest of the world will also hurt Alabama’s exports; in 2019, Alabama exports to China, the state’s third largest trading partner, totaled $2.2 billion, about 11 percent of the state’s total exports. The global economy is most likely already in recession. Overall, the length of the downturn and the subsequent recovery will depend on how strong the policy responses (both monetary and fiscal) are and how these policies help businesses, state and local governments, and households weather the shock of the COVID-19 pandemic.


2020 Economic Outlook

  • January 15th, 2020

2020 Economic Outlook Conference Review

The Center for Business and Economic Research (CBER) held the 2020 Economic Outlook Conference January 9, 2020 at the Capital City Club in Montgomery. Attendees from all over the state gathered to network and get some perspective into what 2020 might have in store for the state. Speakers included several CBER staff members, as well as David Altig, Executive Vice President and Director of Research at the Federal Reserve Bank of Atlanta, and David Bronner, Chief Executive Officer of the Retirement Systems of Alabama. The presentations from the conference are now available on our CBER’s website on the Alabama Economic Outlook page, offering a chance to review some of the very interesting perspectives shared this year. Thanks to all who attended this year’s conference, and we hope that if you weren’t able to make it this year, you’ll join us for 2021.

How Can the 2020 Census Improve Alabama’s Rural Health Care?

  • November 5th, 2019

National Rural Health Day 2019

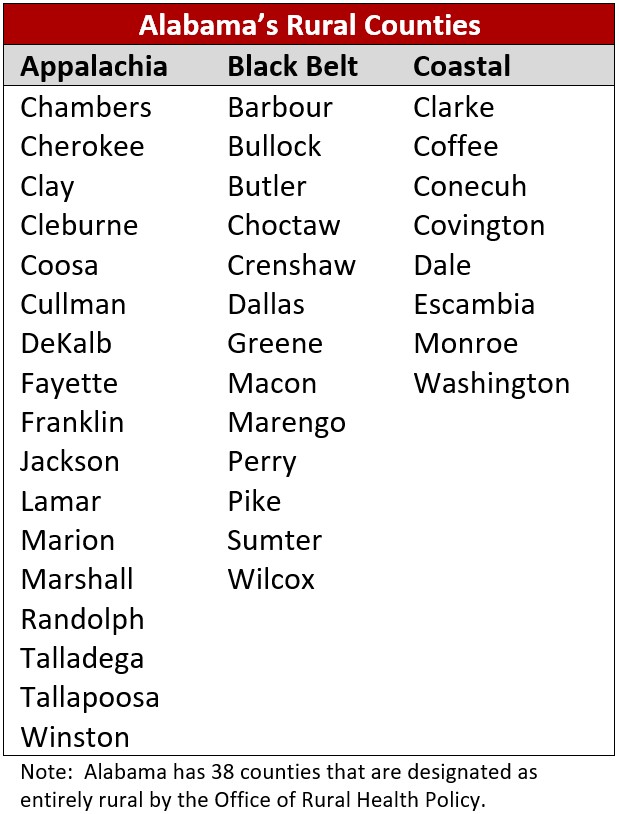
November 21, 2019 is National Rural Health Day. There are many health care challenges that disproportionately affect rural areas in Alabama, including the loss of rural hospitals and a need for funding to provide health insurance to the uninsured. These issues can be helped by federal funding that is allocated to states based upon responses to the decennial census.

According to the Alabama Hospital Association, seven rural hospitals have closed throughout the state in the last eight years due to the financial challenges faced by rural healthcare providers. Of the rural hospitals that are still in operation, 88 percent are in the red and face the ongoing challenge of providing uncompensated care to thousands of uninsured Alabamians.

Alabama’s rural counties have a higher percentage of people who are without insurance and whose income is below the poverty level. In Alabama’s rural counties, 12.1 percent of all people are uninsured and 23.4 are in poverty.  Statewide, 10.7 percent of all people are uninsured and 18 percent are in poverty. A full and accurate count of Alabama’s population and its characteristics is essential when allocations are made to states for programs designed to provide health insurance to those who otherwise would be uninsured or unable to afford nutritious food due to poverty. For instance, in fiscal year 2016, Alabama programs received the following funding based on data gathered in the 2010 Census:

Medicaid: $3.96 billion

Medicare Part B: $1.13 billion

Children’s Health Insurance Program (CHIP): $457 million

Supplemental Nutrition Assistance Program (SNAP): $1.2 billion

Supplemental Nutrition Program for Women, Infants, and Children (WIC): $110 million  


Completing and returning your 2020 census form is a simple civic duty that will ensure Alabama receives its fair share of funding. In mid-March 2020, the U.S. Census Bureau will mail a packet to every Alabama home. The census can be completed online, over the phone, or by paper form. Remember—Alabama Counts!

More data on healthcare coverage and poverty in Alabama are available at: https://www.census.gov/data.html

Data (press release) provided by: Dr. Shannon Murphy, a Socioeconomic Analyst who works for the Center for Business and Economic Research (CBER) within the Culverhouse College of Business. Dr. Murphy may be reached by phone at (205) 348-9698 or by email at shannon.murphy@cba.ua.edu.

The Center for Business and Economic Research in the Culverhouse College of Business at The University of Alabama was created in 1930, and since that time has engaged in research programs to promote economic development in the state and provide economic and demographic forecasting, data, and analysis. CBER is a member of the U.S. Census Bureau Federal-State Cooperative for Population Estimates (FSCPE) and Federal-State Cooperative for Population Projections (FSCPP) programs, and houses the Alabama State Data Center (ASDC).


CBER Researcher Article Published in Population Review Journal

  • November 5th, 2019

CBER researcher, Viktoria Riiman, collaborated with computer scientists from national laboratories: Peter Pirkelbauer, Amalee Wilson, and Reed Milewicz, on using artificial neural networks for population projections. Their article “Comparing Artificial Neural Network and Cohort-Component Models for Population Forecasts” was published in the “Population Review” journal recently. As the title suggests, the article compared the forecasts generated by the artificial neural network models with population projections from the traditional cohort-component method, for counties in Alabama. The authors used population projections produced by CBER in 2001. CBER is a member of the U.S. Census Bureau Federal-State Cooperative for Population Estimates (FSCPE) and for Population Projections, with FSCPE program having celebrated its 50th year in 2017.


Alabama Businesses Regain Confidence Moving into Q4 2019

  • November 5th, 2019

TUSCALOOSA, Ala. — Business leaders throughout Alabama are feeling confident moving into the fourth quarter of 2019, according to a recent report from The University of Alabama.

The Alabama Business Confidence Index, a quarterly survey of statewide business sentiment by the Center for Business and Economic Research in UA’s Culverhouse College of Commerce, showed a slight improvement in statewide business confidence, gaining 0.8 points to register at 59.3. All of the component indexes remained moderately to strongly positive, signaling Alabama business leaders’ continued expectations for economic growth in Q4 2019.

Each quarter, CBER reaches out to business leaders throughout Alabama with a simple survey about their expectations for the coming quarter. Four of the six questions gauge the panelists’ specific industry expectations, including their sales, profits, hiring, and capital expenditure, and the remaining two focus on the general economic conditions in Alabama and the US. Once CBER has analyzed the results, reports offering insight into statewide business confidence, as well as the four state’s four largest metro areas, are available on the CBER website. Alabama businesses, as well as local governments and chambers of commerce, use the ABCI to get a feel for the business community’s expectations or measure their own forecasts against.

Heading into the fourth quarter of 2019, business confidence has somewhat stabilized throughout the state’s four largest metropolitan statistical areas (MSAs) this quarter after more dramatic swings in the beginning of 2019. Like in Q3 2019, Montgomery is the only metro area that communicated negative business confidence with a mildly negative ABCI of 48.5. Meanwhile, Huntsville business leaders continue to lead in confidence with a very strong Q4 2019, while Mobile’s business community is also very confident moving into this quarter. Panelists in Birmingham-Hoover are more moderate in their expectations but are also feeling optimistic about growth compared to the previous quarter.

Looking at specific industries in Alabama, panelists in the “All Other Services” have the highest industry ABCI after increasing 1.7 points to reach 66.2 in the Q4 2019 survey. The “All Other Services” category includes management of companies and enterprises; education services; arts, entertainment, and recruitment; accommodation and food services; and other services that don’t fit into the survey’s other categories. Other industries were largely optimistic in their forecasts, with only wholesale trade forecasting a slight decrease in their industry categories this quarter.

For more details about the various industries’ responses, results broken down by firm size, and the specific levels of business confidence heading into the last quarter of 2019, you can view the ABCI reports here.

Census Shows Growth Rate of Two Alabama Rural Counties Exceeds National Average

  • August 20th, 2019

Alabama’s fastest growing counties have traditionally been in the state’s metropolitan areas, but a couple of counties usually considered “rural,” have, in the past two years, seen healthy growth rates that have eclipsed the national average growth rate of 2.2 percent, according to Annette Watters, assistant director of the Center for Business and Economic Research at The University of Alabama and manager of the Alabama State Data Center.

Watters said just-released figures from the Census Bureau show Bibb County, adjacent to Shelby and Tuscaloosa counties, grew 4.6 percent, while Cleburne County, in the eastern part of the state near Anniston on the Georgia border, grew 2.9 percent.

“The other fast-growing counties in Alabama are all part of a Metropolitan Statistical Area and have been fast-growing counties for many years,” Watters said.  “Those counties, in order of growth rate from 2000 to 2002 are Shelby, Baldwin, Autauga, Elmore, Blount, St. Clair, Madison, Limestone and Lee.”

Watters pointed out that a fast rate of growth is not the same as a county seeing a large number of people added. “Bibb County, for example, with its gain of 4.6 percent in two years time, added 969 residents.  Houston County, the home county for Dothan, added slightly more people – 1,048 – than Bibb County, but because Houston County’s population base is so much larger, those 1,048 people equal only a 1.2 percent increase for Houston County.”

As might be expected and as has been the case for several years, Shelby County leads the state in both the number of people added and the percent of growth.  “Between 2000 and 2002, Shelby County added an estimated 9,296 people which amounts to a growth rate of 6.4 percent,” Watters said.

Watters pointed out that Madison County, home of Huntsville, added the second largest number if people (8,327) and Baldwin County in South Alabama added the third largest number (6,522).  Lee, Elmore and St. Clair each added more than 2,000 people over the past two years.

Some counties are losing population. Choctaw County, in the state’s Black Belt, has lost nearly 3 percent of its total population in two years.  The county that lost the largest number of people is Jefferson County, which lost an estimated 960 people in two years.

The Census Bureau makes the estimates for July 1 of each year.  “It is not really appropriate to compare the July 1 estimates with the Census 2000 numbers because the census was taken on April 1,” Watters said, “and a lot of things can happen in a county over a three-month period.  So the Census Bureau estimates the population for every county for July 1 of Census Year 2000 and compares subsequent years’ estimates for July 1 to the July 1 estimate of 2000, not the Census 2000 count.”

Other highlights:

  • Eleven counties in Alabama have more than 100,000 people.  Of the 11 most populous counties, seven were not among the fastest growing, either by the percent of increase of by the number of residents added.
  •  The Census Bureau estimates that 39 of 67 Alabama counties have lost population over the past two years.
  •  Twelve counties gained more than 1,000 people each over the same period.
  • Of the counties in Alabama that have gained the most people in the past two years, only Marshall County is not part of a MSA.

Information about any county in Alabama can be obtained at http://cber.cba.ua.edu.

The University of Alabama’s Culverhouse College of Commerce and Business Administration, founded in 1919, first began offering graduate education in 1923.  Its Center for Business and Economic Research was created in 1930, and since that time has engaged in research programs to promote economic development in the state while continuously expanding and refining its base of socioeconomic information.

Eleven Fastest-Growing Counties in Alabama by Percent Increase:  July 1, 2000 to July 1, 2002


Rank

County Name Percent Increase Numerical Increase July 1, 2002 Estimated Population
1 Shelby 6.4 9,296 153,832
2 Bibb 4.6 969 21,838
3 Baldwin 4.6 6,522 147,932
4 Autauga 3.9 1,701 45,604
5 Elmore 3.8 2,508 68,771
6 Blount 3.4 1,755 52,968
7 St. Clair 3.2 2,100 67,215
8 Madison 3.0 8,327 285,900
9 Limestone 2.9 1,903 67,842
10 Cleburne 2.9 406 14,578
11 Lee 2.3 2,639 118,123

Eleven Most Populous Counties in Alabama:  July 1, 2002

      July 1, 2000-July 1-2002
Rank County Name July 1, 2002 Estimated Population Percent Change Number Change
1 Jefferson 661,153 -0.1 -962
2 Mobile 400,163 0.0 77
3 Madison 285,900 3.0 8,327
4 Montgomery 223,346 0.0 -23
5 Tuscaloosa 166,512 0.9 1,445
6 Shelby 153,835 6.4 9,296
7 Baldwin 147,932 4.6 6,522
8 Lee 118,123 2.3 2,639
9 Morgan 111,725 0.5 516
10 Calhoun 111,616 0.2 266
11 Etowah 103,105 -0.2 -194

Urban Area Criteria for Census 2000

  • August 20th, 2019

The Census Bureau classifies urban and rural population and delineates urbanized areas after each decennial census. This process began with the 1950 census. Since the 1950 census, the Census Bureau has revised these criteria for each decennial census, taking advantage of improvements in data collection, reporting methodologies, and advancements in technology.

The Census Bureau identifies and tabulates data for the urban and rural population solely for presenting census statistical data. The Bureau does not take into account any nonstatistical uses that may be made of the data and it does not attempt to meet the requirements of nonstatistical program uses. Nevertheless, the Census Bureau recognizes that some federal and state agencies are required by law to use Census Bureau-defined urban and rural classifications for allocating program funds, setting program standards, and implementing aspects of their programs. The Bureau recognizes that the urban and rural designations represent areas where people live, work, and spend their lives. People have a considerable amount of pride about where they are and have strong opinions about the concepts of urban and rural. With this series of definitional revisions, the Bureau has tried hard to make all the decisions about urban/rural designation to be equitable, uniform, and objective for the entire nation.

“Urban” will be all population residing within Urbanized Areas and Urban Clusters. “Rural” will be all population and territory not within any UA or UC.

Urbanized Areas and Urban Clusters

  • A. Urbanized Areas. For Census 2000, an urbanized area (UA) will consist of a densely settled core of census block groups (BGs) and census blocks that meet minimum population density requirements. These densely settled, adjacent census blocks must encompass a population of at least 50,000 people. At least 35,000 of the people must live in an area that is not part of a military installation.
  • B. Urban Clusters. For Census 2000, an urban cluster (UC) will consist of contiguous, densely settled core of census block groups (BGs) and census blocks, along with adjacent densely settled census blocks that together encompass a population of at least 2,500 people, but fewer than 50,000 people.

Places. The Census Bureau will use UAs and the new concept of UCs, rather than places, to determine the total urban population. Previously, place boundaries were used to determine the urban and rural classification of territory. All incorporated places that had at least 2,500 people were classified as urban. The UC concept, based solely on census BGs and census blocks, does not recognize incorporated place boundaries. This eliminates bias by removing the effect of state laws governing incorporation and annexation.

Naming. The UA or UC title will be the name of the incorporated place with the most population. As many as two additional incorporated place names can be part of the title. Previously, many UA central places and titles were based on MA central city definitions. Under the new rules, UA and UC titles do not need to follow MA central city definitions. The Census Bureau will assign a 5-digit numeric code to each UA and UC.

Grandfathering. The Census Bureau will not automatically recognize previously existing UA territory for Census 2000. There will be no “grandfathering” of areas that qualified for earlier censuses. Grandfathering was used extensively in past censuses. The Census Bureau is trying to bring the urban area criteria back to a single set of rules that allow for application of automated processes that yield consistent results rather than to have the areas defined through a process of accretion over time. The Bureau is striving to eliminate any subjectivity in these delineations. They believe that Census 2000 gives them the opportunity to reexamine areas that qualified as urban areas in earlier censuses due to different criteria, misinterpretation of criteria, and the inevitable mistakes made during clerical delineations of the past. Thus, grandfathering will not be allowed. Areas that no longer qualify as a UA will likely qualify as a UC for Census 2000.

Jumps and Hops. Noncontiguous areas may qualify to be included with the core of an urbanized area or urban cluster under certain circumstances. The new criteria increase the permitted jump distance from 1.5 miles in 1990 to 2.5 miles in 2000. The increase in the permitted jump distance recognizes improvements in the transportation network and the associated changes in development patterns. The change also recognizes that governments sometimes provide “green space” between developments.

The rules for jumps over uninhabitable territory are changing. The new rules change the terminology from “uninhabitable” to “exempted.” The original uninhabitable criteria for Census 2000, which were more restrictive than in the past, were limited to bodies of water, military installations, national parks, and national monuments. Because of input from the public, the Census Bureau decided to include as exempted some features such as floodplains and marshlands that meet specific criteria. See the March 15 Federal Register for a detailed discussion of this topic.

Jumps between qualifying areas that are less than 0.5 miles are hops, not jumps. Hops are small, nonqualifying census blocks developed for nonresidential uses, such as schools, shopping centers, office complexes, industrial parks, and parks or other green space. Territory that is two jumps away from a central core can’t be added to the UA. But hops are allowed after jumps, and jumps after hops.

Governmental Boundaries. Boundaries of governmental units will be invisible to the process. Many densely settled, unincorporated areas will be classified as urban for the first time. The overwhelming majority of these densely settled unincorporated areas are located adjacent to incorporated places in states with strict annexation laws. The total urban population for Alabama is not as likely to be affected by the rules change as will be the population of states such as Connecticut, Massachusetts, Michigan, New Jersey, New York, or Pennsylvania.

There are elaborate rules for determining, for each block in the country, whether it is “densely settled,” whether or not it is contiguous to other blocks that are densely settled, and whether it qualifies through a jump or a hop to be included with other densely settled blocks to be part of an Urban Cluster or an Urbanized Area. (See the Federal Registernotice Wednesday, March 28 2000, pages 17018-17033 and the Federal Register notice Friday, March 15 2000, pages 11663 -11670 for details.) Because legal boundaries no longer play a part in qualifying territory as urban or rural, every block had to be evaluated on its own merit. This is a time-consuming process, and for this reason the Census Bureau’s Summary File 1 for Census 2000 did not originally have urban/rural designations. Urban/Rural was added to Summary File 1 in Tables P2 and H2 on June 9, 2003.

“Day time” vs. “Night Time” Population. Please note that the urban/rural designations will continue, as in the past, to be based on housing units. That is, they reflect “night time” populations, where people live, as opposed to “day time” populations, where people work.

Census Bureau Releases Population Estimates for Alabama’s Cities and Towns

  • August 20th, 2019

The U.S. Census Bureau has released new population estimates for Alabama’s cities and towns that give the state its first indications of growth since the 2000 census, according to Annette Watters, assistant director of the Center for Business and Economic Research at The University of Alabama and manager of the Alabama State Data Center.

Which city grew the fastest? Huntsville added 2,582 people between 2001 and 2002. Calera, in Shelby County, grew 15.5 percent in that same time period. Calera’s 2001 population was 3,722 and its 2002 population was 4,299, meaning the city added 577 people in a year’s time, which is a good many fewer than the 2,582 that Huntsville added. However, the higher population numbers don’t tell the whole story.

“Calera is this year’s winner as those 577 people represent more than 15 percent growth for the town in one year,” Watters said. “Huntsville’s 2,582 new people represent a growth of just 1.6 percent.”

According to the U.S. Census Bureau, four cities in Alabama gained more than 1,000 people between 2001 and 2002: Huntsville (2,582), Auburn (1,356), Madison (1,355) and Tuscaloosa (1,011). Both Pelham (982) and Prattville (931) came close to the 1,000 mark.

“Birmingham remains Alabama’s largest incorporated place, despite continuing population losses,” Watters said. “Montgomery is the state’s second largest city, followed by Mobile, Huntsville, Tuscaloosa, Hoover, Dothan, Decatur, Auburn and Gadsden, in descending order of population size.”

Mobile’s population declined between 2001 and 2002, as did Decatur’s.

These newest estimates for cities and towns take into account some corrections that have been made to the 2002 census. Some municipalities filed challenges with the Census Bureau and have had their 2000 census number changed, usually to reflect an increase.

“Several cities and towns in Alabama have shown the Census Bureau that it failed to account for something important when the census was taken, and the Census 2000 totals for those places have been changed,” Watters said.

Not all cities that have filed a Census 2000 challenge have had their changes made and their paperwork still is in the pipeline. As a result, those revisions are not reflected in these newly released population estimates.

“We need to remember that the population figures for 2001 and 2002 are estimates, not literal truth,” Watters said. “If the elected officials of a town believe their estimate is in error, the Census Bureau is very willing to consider changing the number – but the city has to produce proof, not just rhetoric or anecdotal evidence.

She added that getting the estimate revised does not need to be an adversarial process. Officials just need to provide the necessary documentation the federal agency needs to make a correction.
A boon of the new census numbers is that four Alabama cities are ranked nationally for their large populations. To be ranked, an incorporated city must have a population of at least 100,000.

City
Birmingham
Montgomery
Mobile
Huntsville

Population
239,416
201,425
194,862
162,536

Rank
72
92
103
128

Watters noted that the estimates include the time period through July 1, 2002. If a city has experienced a growth spurt during the most recent 12 months, that will be reflected in future estimates.

FIFTEEN LARGEST CITIES IN ALABAMA, 2002

City
1. Birmingham
2. Montgomery
3. Mobile
4. Huntsville
5. Tuscaloosa
6. Hoover
7. Dothan
8. Decatur
9. Auburn
10. Gadsden
11. Florence
12. Madison
13. Bessemer
14. Phenix City
15. Prichard

2002 Population Estimate
239,416
201,425
194,862
162,536
79,149
64,265
58,998
53,941
45,389
37,966
35,814
32,335
29,503
28,503
28,200

For more information, visit a table with the 2002 population estimate of every Alabama city and town.