
The Great Recession: 18-Months Before, During, and After
- July 24th, 2019

Recent numbers indicate that Alabama job growth may finally be picking up from the slow pace seen since the last recession. The state added 31,600 jobs between September 2013 and September 2014. That’s one of the highest rates of job growth during a 12-month period since the U.S. economy fell into recession in December 2007.
Job gains were spread across most sectors. Goods producing businesses added 11,000 workers, including 7,900 in manufacturing. Firms producing transportation equipment, particularly motor vehicle parts, and primary and fabricated metals saw the largest employment growth. With improvement in residential and commercial real estate markets, the construction sector is rebounding. The addition of 2,800 construction jobs in the past year includes 1,700 in building construction.
Payrolls in the state’s services sector grew by 20,600 between September 2013 and September 2014. Food service and drinking places added 10,000 workers, professional and business services gained 7,900, and educational services added 1,900. However, relatively sluggish consumer spending and demand conditions are hurting retailers, who shed 2,000 jobs over the past year. In the government sector, federal employers cut 1,000 jobs, while the state added 500 and local governments gained 1,600 jobs.
Economists from the Center for Business and Economic Research in UA’s Culverhouse College of Commerce have raised their annual employment forecast for 2014. The state should create about 25,000 to 30,000 new jobs this year, a gain of around 1.1 percent that compares to just 0.5 percent in 2013. Job growth is expected to be somewhat stronger in 2015.
Inflation-adjusted Alabama GDP is expected to increase by about 1.5 percent in 2014, followed by stronger growth of around 2.3 percent for 2015. However, the concentration of job gains in sectors of the economy that pay relatively low wages and/or hire temporary or part-time workers will likely contribute to subdued growth in income tax collections and relatively weak consumer demand.
Alabama business executives remain optimistic about their prospects for the fourth quarter of 2014. CBER’s Alabama Business Confidence Index™ (ABCI) slipped 1.3 points to 54.2, indicating growth at a slightly slower pace than in the third quarter. The state’s business community is, however, more optimistic than a year ago when the ABCI reading was 51.9. Panelists continue to have a more positive outlook for the state than the national economy. For fourth quarter 2014, confidence in the Alabama economy registered 56.4, while the U.S. outlook reading was 51.6.
State tax revenues for FY2014, which ended in September, totaled $9.4 billion, up 1.3 percent from the previous fiscal year. Sales tax revenues rose 2.6 percent to $2.1 billion, while corporate income tax receipts increased 4.2 percent. Individual income tax revenues fell a slight 0.04 percent to $3.8 billion. Appropriations to the Alabama Education Trust Fund increased 2.1 percent compared to FY2013 and General Fund appropriations were up 1.0 percent. CBER forecasts tax revenue growth of 1.5 to 2.0 percent for FY2015.
Alabama exports totaled $9.673 billion during the first half of 2014, just below the same period in 2013. Exports to Canada were down slightly, while China, the state’s second largest trading partner, saw an increase. Shipments of transportation equipment rose by $215 million to total around $4.3 billion.
Recent numbers indicate that Alabama job growth continues its slow but solid pace. The state added 24,500 jobs between October 2015 and October 2016.
Most of job gains were in services providing firms that added 20,700 workers. Employment levels within goods-producing firms also rose, by 3,800. Despite an improvement in both residential and commercial construction activity in the state, overall employment in construction-related firms fell by 2,200 over the twelve-month period ending in October 2016. Meanwhile, manufacturing industries in the state gained 6,500 net new jobs: durable goods manufacturers added 2,200 jobs while producers of nondurable goods added 4,300.
Among service-providing firms, job gains were predominantly associated with retail trade that added 9,400 workers, mainly in general merchandising stores. Government entities added 5,300 jobs, financial activities 5,200, professional, scientific and technical services added 4,200, and healthcare and social assistance sector added 2,600 jobs. Payrolls in the wholesale trade sector lost 2,400 workers while the accommodation and food services industry lost 1,200.
Economists from the Center for Business and Economic Research in UA’s Culverhouse College of Commerce have kept their annual employment forecast for 2016 unchanged. The state should create about 20,000 to 25,000 new jobs this year, a gain of around 1.0 percent that compares to 1.2 percent in 2015. Job growth is expected to be somewhat weaker in 2016.
Updated forecast for inflation-adjusted Alabama GDP predicts an increase of about 1.4 percent in 2016, up from 2.3 percent in 2015. The concentration of job gains in sectors of the economy that pay relatively low wages and/or hire temporary or part-time workers will likely contribute to subdued growth in business spending and relatively weak consumer demand.
Even with a weaker state economic growth expected in 2016, tax receipts should continue to rise. An increase of about 1.5 percent is forecasted for fiscal year 2017. Total tax revenues were up 1.2 percent in FY2016 ending in September, totaling about $9.9 billion. Appropriations to the Alabama Education Trust Fund were up by 0.4 percent, totaling $6.1 billion during that fiscal year. Annual total appropriations to the state’s General Fund were down 0.7 percent to approximately $1.8 billion in FY2016.
State exports rose by $778.1 million to $10.2 billion during the first six months of 2016 compared to the same period in 2015. Canada remained the state’s largest export market with exports totaling $4.1 billion in 2015. Transportation equipment manufacturing continues to be the state’s largest export sector. These exports rose to $5.4 billion during the first six months of 2016, up by $1.2 billion from the same period a year ago.
Business executives in Alabama believe education and workforce training is the top issue currently facing the state. Education and workforce training ranked second in the 2015 survey and was one of the most significant shifts in rankings from the previous year.
Business executives are surveyed annually by the Center for Business and Economic Research in The University of Alabama’s Culverhouse College of Commerce on various topics related to issues facing the state and their respective companies. More than 104 business executives participated in the latest survey in November 2016. The survey has been conducted since 2013 and asks for opinions of the Alabama Business Confidence Index™ (ABCI) panelists.
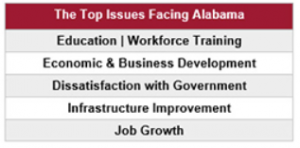
While education and workforce training top the issues facing the state, economic and business development, dissatisfaction with government, infrastructure improvement and job growth rounded out the issues facing the Alabama.
In issues affecting companies directly, business executives ranked “economy in general” their top issue, which ranked fourth in the 2015 survey. Business leaders specifically mentioned the growth of the state and national economy, consumer confidence and a slow economic recovery.
Government regulations and taxes ranked closely to the economy in general in the individual company portion of the survey. Workforce and company finances and development were the third and fourth-ranked issues facing companies.
Each quarter, business executives across Alabama take the ABCI survey. Seventy-one percent of ABCI panelists use the results as a general indicator of local or regional economic outlook. Nearly 53 percent of business executives also compare personal projections to others’ viewpoints, and 43 percent use the ABCI results as a background information for estimating future trends. Additionally, almost 30 percent of business executives share results with others and 24 percent use the ABCI results in short-term planning.
The ABCI panel is open to business executives across the state. Registration and current and historical results are available on the ABCI website. Newsletters with results are provided for Alabama and for the Birmingham-Hoover, Huntsville, Mobile, and Montgomery metro areas. Panelists can take the Q2 2017 survey March 1-15.
Business confidence registered at 61.6 in the third quarter 2017 Alabama Business Confidence Index TM (ABCI) survey conducted by the Center for Business and Economic Research at the University of Alabama’s Culverhouse College of Commerce.
The ABCI is compiled from a quarterly survey sent to business leaders throughout the state gauging their expectations for the coming quarter compared with the current. The six component indexes that make up the ABCI reflect panelists’ expectations for industry sales, profits, hiring, and capital expenditures as well as their forecasts for the statewide and national economies. An index value above 50 indicates a positive outlook, and the higher the index, the more confident the economic outlook.
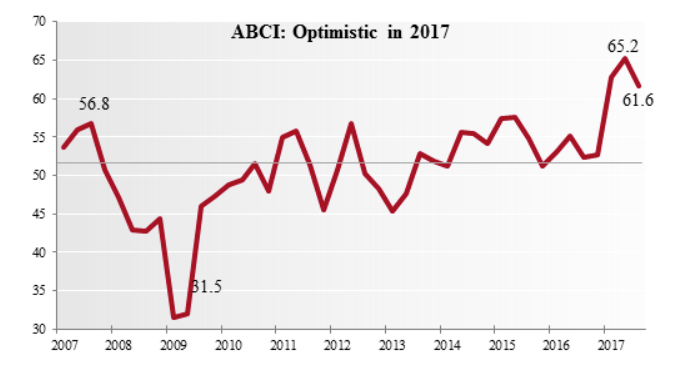
In the third quarter 2017 survey, the ABCI decreased 3.6 points from Q2 2017’s ten-year high to reach 61.6. This is the third consecutive quarter that the ABCI has registered levels above 60, while the average for the last five years is 54.3. This suggests expectations for economic growth have been increasing significantly since the first quarter of 2017, and though the actual index value has decreased this quarter, many business leaders expect continued growth in the third quarter of 2017.
In general, Alabama business leaders are continuing to forecast a strong Alabama Economic Outlook, with the index only losing 3.4 points to remain high at 64.2 this quarter. In Q2 2017, the Alabama economy index reached a ten-year high of 67.6, and in this quarter, 59.6 percent of business leaders throughout the state expect even better statewide economic conditions compared to Q2 2017. Exactly one third expect conditions to remain the same in the coming quarter, and only 7.0 percent expect worse conditions than were seen in the previous quarter. The Alabama Economic Outlook decreased slightly in the four metro areas but remained very confident with the lowest index value in Birmingham-Hoover registering 61.5 and the highest confidence for statewide economic growth compared to the previous quarter occurring in Montgomery with an index of 65.5.
In the Q3 2017 survey, all but one of the industry ABCIs registered above 50, indicating overall expectations for growth in the coming quarter. Many of the industry ABCIs were very high last quarter, so most ABCI values decreased from the previous quarter’s levels but remained positive. Five of the nine industry categories had ABCIs above 60, showing high levels of confidence for the third quarter of 2017, and only retail trade had an ABCI below 50. Manufacturing had the highest ABCI with an index of 68.1 after only decreasing 0.1 points from its Q2 2017’s ABCI. Panelists in manufacturing led in confidence in with the highest values in all component indexes, indicating high expectations for continued industry growth moving into the third quarter. Business confidence in retail trade fell 9.5 points this quarter, making it the lowest industry ABCI at 46.5. Panelists in retail trade expect a slowdown in hiring, profits and sales compared to the second quarter’s levels of growth.
Business leaders in Alabama’s four largest metro areas continue to respond optimistically, with all metros forecasting growth in the third quarter of 2017. ABCI Montgomery and ABCI Huntsville show the strongest confidence with overall index scores above 62, and ABCI Mobile was not far behind with an index reading of 61.9. Even the lowest metro ABCI, which was recorded in Birmingham-Hoover, remained high at 59.1 this quarter.
Alabama firms expect growth to continue with moderately strong confidence moving into the third quarter of 2017. All three size categories had ABCIs between 60 and 65 and optimistic forecasts for national and statewide economic growth. For the second consecutive quarter, mid-sized firms, those with 20 to 99 employees, have the highest ABCI at 64.8 even after a 1.9-point decrease from the previous quarter’s index. Mid-sized businesses have the highest levels of confidence in all four component indexes: sales at 67.7, hiring at 64.6, profits at 64.1, and capital expenditure at 62.0. Small firms have high confidence in increased sales compared to Q2 2017, and large firms expect sales and capital expenditures to grow with moderately high confidence in the coming quarter.
Samuel Addy, Ph.D. and Ahmad Ijaz
Center for Business and Economic Research
Culverhouse College of Commerce and Business Administration
The University of Alabama
September 2010
Summary
This report presents preliminary macroeconomic impact estimates of the BP Deepwater Horizon oil spill on Alabama for 2010. The purpose is to provide some sense of the effect of the disaster on the state and to provide information that can help the state make claims for resulting lost tax revenue in the first year. We consider only macroeconomic impacts and not (i) micro impacts that businesses and individuals can use for making claims or (ii) environmental, ecological, and noneconomic quality of life impacts that contribute to determining the full effects of the disaster.
Four scenarios for impact estimates are considered in a sensitivity analysis to account for the uncertainty regarding such disaster estimates, especially since the year is not yet over. The scenarios involve different loss effects on tourism and fishing activities in the state from year 2008 levels. The worst case assumes 30 percent and 80 percent annual net loss on tourism and fishing, respectively; the optimistic case involves corresponding losses of 7.5 percent and 50 percent.
In the worst case the oil spill results in losses of $3.3 billion in Alabama economic output, $971 million in earnings, and nearly 49,000 jobs for 2010. Individuals and businesses could make $1.6 billion in claims and state and local governments could make a collective $149 million claim for lost tax revenues. The optimistic case results in (i) losses of about $1.0 billion in economic output, $284 million in earnings, and 13,600 jobs and (ii) claims of $463 million for individuals and businesses and $41 million for state and local government.
The oil spill’s effects are expected to last a number of years. Future year impacts will depend on additional information gained about the nature of the spill and the response and their combined environmental/ecological and quality of life effects. Such information will reduce the uncertainty regarding the disaster’s 2010 and subsequent years’ macroeconomic impacts.
Introduction
On April 20, 2010 the Deepwater Horizon oil drilling rig exploded in the Gulf of Mexico and resulted in 11 deaths, 17 injured, and a gush of about 53,000 barrels of crude oil per day from the seabed. Response to the spill involved containment, dispersal, removal and some burning, and a moratorium on deep offshore drilling activities. The gushing oil was stopped on July 15, 2010 by capping the Macondo well from which it was flowing. While the official flow rate has established the spill as the largest in U.S. history, there is still some uncertainty regarding the flow rate and total amount spilled. The U.S. government considers BP to be the responsible party for the disaster and has negotiated a $20 billion fund—which is not a cap and has the company’s U.S. assets as bond until fully paid for—to be used for purposes that include government response expenditures and claims from affected parties. There is significant uncertainty regarding the effects of this event and the response to it on the environment, ecology, economies, and people of the region. Determining the full impacts of the oil spill will take time, but there are immediate needs and claims that must be paid as the spill generated ongoing adverse effects on the economies and people of the region.
Comprehensive studies of the impacts of disasters such as the oil spill are complex because they must consider tangible and intangible effects on the environment, ecology, and quality of life along four dimensions (visibility, spatial, time, and distributional). The environmental and ecological effects need to be studied over time because of the dynamics of biological, chemical, and physical processes that help in determining effects on the environment, wildlife, food chain, toxicity issues, and ecosystems in general. Indeed, scientists are yet to fully account for the oil that gushed out, a question of inventory. Quality of life effects must cover economic impacts at micro and macro levels as well as social, cultural, psychological, health, political, and other issues. The visibility dimension demands considering direct, indirect, visible, and invisible impacts. The spatial dimension requires a look at distance, direction, and depth (surface, underwater, and above surface) impacts. The time dimension focuses attention on the pace and intensity of impacts. The fourth and final dimension, distributional, necessitates the determination of who and what systems are affected, how they are affected and by how much, and whether and how they should be compensated.
The motivation for this work comes from the need to understand somewhat the effect of the disaster on Alabama and to facilitate claims to recover losses due to the oil spill’s ongoing adverse effects on the state economy. The impacts presented in this report are just a small slice of the full impacts on Alabama and are preliminary macroeconomic impacts of the spill for 2010 only. We do not address (i) subsequent year impacts, (ii) micro impacts that businesses and individuals can use for making claims, or (iii) environmental, ecological, and noneconomic quality of life impacts. To deal with the uncertainty that disaster impact studies have to contend with, we use a sensitivity analysis on key variables—the net loss factors to tourism and fishing activities—that the oil spill causes. Our results provide some sense of the effect of the disaster on the state’s economy and hopefully provide an objective, reliable, and transparent analysis that the state can use to make a claim for lost state and local tax revenue in 2010.
Analysis and Results
Given that the oil spill was offshore and impacted coastal areas, one would expect that the spill’s direct and initial effects will be principally on tourism (which includes recreational fishing), commercial fishing, and water transportation. The interaction between these economic activities and the rest of the economy will result in indirect effects which must be combined with the direct effects to determine the macroeconomic impacts. This requires the use of economy-wide methodologies to determine impacts. Methods used in estimating economic impacts include econometric, economic base, computable general equilibrium (CGE), and input-output (I-O) models. Econometric and CGE models can be very costly and time-consuming to build and economic base models require a very detailed set of information that is sometimes not available. These three methodological approaches generate slightly smaller multipliers than I-O models because of assumptions on factors such as input substitution and optimization behavior by economic agents (consumers, businesses, and governments). The I-O modeling technique, which generates multipliers for economic activities of interest by focusing on economic interactions among all industries and all other economic transactions in a specified region, was used in this study. The multipliers used were obtained from the Regional Input-Output Modeling System (RIMS II), which is developed and maintained by the U.S. Department of Commerce’s Bureau of Economic Analysis. RIMS II is available for the nation, states, metro areas, and counties as well as for geographic areas for which enough information exists to construct a model.
To allow for uncertainty regarding disaster estimates and especially since we focus on estimates for 2010 while the year is not over, we consider four scenarios in a sensitivity analysis on losses to the directly affected economic activities. The scenarios involve different net loss effects on tourism and fishing activities in the state from year 2008 levels; we assume no losses for water transportation since we are unaware of any such reports, not even anecdotally. The base year of 2008 is the most recent year for which we could assemble a complete set of data for the analysis. The worst case assumes 30 percent and 80 percent annual net loss on tourism and fishing, respectively; the optimistic case involves corresponding losses of 7.5 percent and 50 percent. A “somewhat likely” scenario considers 20 percent tourism loss and 80 percent fishing loss and a “very likely” scenario looks at 15 percent tourism loss and 50 percent fishing loss. We use these net loss factors to determine the direct economic effects on Alabama tourism and fishing and then apply the RIMS II multipliers to generate impacts on state economic output, earnings, and employment.
Fiscal impacts are derived from the earnings impacts allowing for the fact that not all of the earnings impacts are sales or income taxable. Spending on sales taxable items constitute 42.4 percent of total earnings and state taxable income (net income) is about 66 percent of earnings. The state income tax rate is generally 5.0 percent on net income; the first $500 and the next $2,500 are taxed at 2.0 percent and 4.0 percent, respectively, for single persons, head of family, and married persons filing separately while for married persons filing joint returns the first $1000 and the next $5000 are taxed at 2.0 percent and 4.0 percent, respectively. Excess net income is taxed at the 5.0 percent rate. Corporations pay at a 6.5 percent rate and corporate income tax is quite stable at about 15 percent of individual income tax. Sales tax rates used are 4.0 percent for the state and 5.0 percent for local (combined county and city) jurisdictions for a total of 9.0 percent. Local sales tax rates vary between 3.0 to 7.0 percent among Alabama counties, but are most frequently at 5.0 percent. State law in 2006 increased the individual income tax threshold by increasing the standard deduction for taxpayers with adjusted gross income of $30,000 or less and by increasing the dependent exemption for taxpayers with adjusted gross income of $100,000 or less. The Education Trust Fund (ETF) portion of state income and sales taxes is determined. Alabama residents pay a host of other taxes and fees, but sales and income taxes are the largest components of taxes paid. The combined income and sales tax revenues share of total state tax receipts is thus used to determine the maximum total state tax revenue lost for each scenario and a similar derivation is made for the ETF.
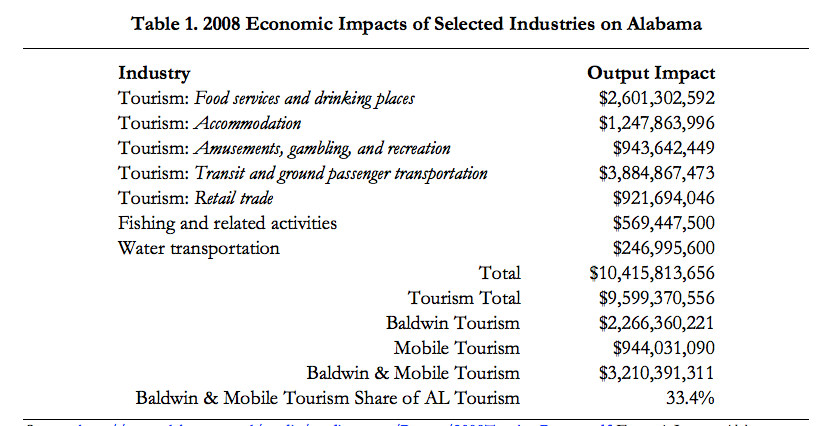
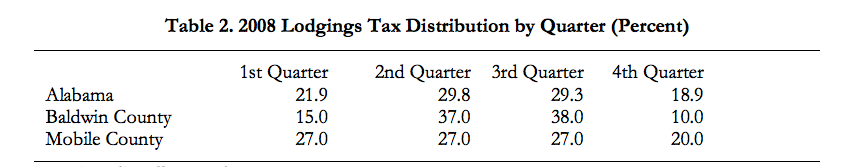
Table 1 shows the 2008 economic impacts of Alabama tourism, fishing, and water transportation on the state. Tourism activities take place within the five industries listed first, but do not account for all of those industries’ impacts on the state; only the tourism component impacts are shown. Tourism in 2008 had a $9.6 billion impact on Alabama, with $3.2 billion or 33.4 percent coming from the two Gulf Coast counties, Baldwin and Mobile. This suggests that the absolute theoretical worst case for Alabama tourism is a 33.4 percent impact loss. Using RIMS II multipliers we estimate impacts of $569.5 million for fishing and $247 million for water transportation. Alabama would have taken a $10.4 billion hit if the oil spill had wiped out all the impacts in the table. Water transportation was not affected to our knowledge, fishing lost at least one major season out of two annually, and tourism was not wiped out—although it was severely impacted—in the two coastal counties. Mardi Gras occurred before the spill, other inland tourism activities continued, and cleanup activities following the spill provided some income generating opportunities for fishermen. Table 2 shows that the explosion of the rig and the capping of the well took place in the two quarters that provide most lodgings tax revenues for Alabama and its coastal counties. We used the lodgings tax distribution to come up with the “somewhat likely” scenario while holding fishing losses at the “worst case” 80 percent level. The “very likely” scenario allows for a salvaging of one major fishing season for a 50 percent loss and half the worst case tourism loss. The “optimistic” scenario halves the tourism loss in the “very likely” scenario while keeping the fishing loss level.
The macroeconomic impacts for each scenario of loss in 2010 are shown in Table 3. In the worst case we adjust theoretical maximum losses of 33.4 percent to tourism and 100 percent to fishing and allow for some tourism and fishing activities prior to the explosion of the rig as well as income generated from cleanup activities to arrive at a 30 percent tourism loss and 80 percent fishing loss. Under this scenario, the oil spill results in losses of $3.3 billion in Alabama economic output, $971 million in earnings, and nearly 49,000 jobs for 2010. Accompanying fiscal impacts are reduced revenues of $46.1 million in local sales tax, $36.8 million in state income tax, and $36.9 million in state sales tax. Of the combined $73.7 million in state income and sales taxes, $67.4 million will be lost to the ETF. State income and sales taxes constitute 72 percent of total state tax collections and suggest that the state could see a maximum loss of $102.8 million if proportionate reductions in all other state tax revenues occur. Similarly, income and sales taxes constitute 92 percent of ETF receipts and thus the fund could see a maximum loss of $73.7 million. The direct loss amount that results in these impacts is $1.6 billion and thus individuals and businesses could make claims totaling that amount. This direct claim amount would be for lost revenues and income and also any damage to property, but not for other tangible or intangible environmental, ecological, and noneconomic quality of life impacts. State and local governments could make a combined $149 million claim for lost tax revenues.
The somewhat likely case of a 20 percent tourism net loss and 80 percent fishing net loss in 2010 results in adverse impacts of (i) $2.4 billion in economic output, $683.4 million in earnings, 33,790 jobs, $31.5 million in local sales tax, $51.1 million in state income and sales taxes as part of a possible $71.3 million total in state tax receipts, $46.8 million in ETF income and sales tax receipts with a possible maximum of $51.1 million to the fund and (ii) claims of $1.1 billion for individuals and businesses and $102.8 million for state and local government.
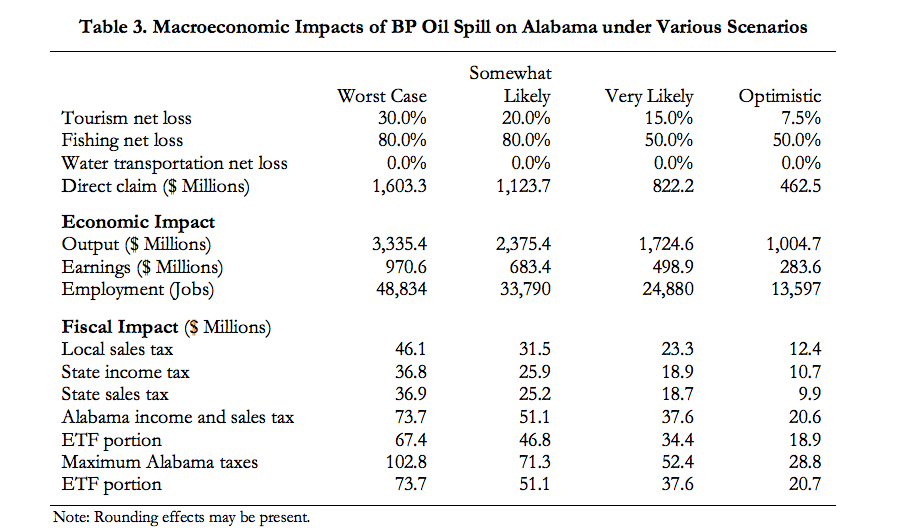
The very likely scenario of a 15 percent tourism net loss and 50 percent fishing net loss in 2010 yields adverse impacts of (i) $1.7 billion in economic output, $498.9 million in earnings, 24,880 jobs, $23.3 million in local sales tax, $37.6 million in state income and sales taxes as part of a possible $52.4 million total in state tax receipts, $34.4 million in ETF income and sales tax receipts with a possible maximum of $37.6 million to the fund and (ii) claims of $822.2 million for individuals and businesses and $75.8 million for state and local government. In the optimistic case of a 7.5 percent tourism net loss and 50 percent fishing net loss, the impacts are reductions of $1.0 billion in economic output, $283.6 million in earnings, 13,597 jobs, $12.4 million in local sales tax, $20.6 million in state income and sales taxes as part of a possible $28.8 million total in state tax receipts, $18.9 million in ETF income and sales tax receipts with a possible maximum of $20.7 million to the fund, and claims of $462.5 million for individuals and businesses and $41.2 million for state and local government.
Conclusions
In this report we have attempted to provide some sense of the effect of the BP Deepwater Horizon oil spill on Alabama for 2010 under four different scenarios. The scenarios considered suggest that the oil spill may have reduced Alabama’s economic output by $1.0 billion to $3.3 billion in 2010 and involved losses of $284 million to $971 million in earnings and 13,600 to 49,000 jobs. Individuals and businesses could make direct claims for lost revenues, income, and property damage of between $463 million and $1.6 billion and a combined claim of $41 million to $149 million can be made for lost state and local tax revenues. We considered only macroeconomic impacts and not (i) micro impacts that businesses and individuals can use for making claims or (ii) environmental, ecological, and noneconomic quality of life impacts that contribute to determining the full effects of the disaster.
The oil spill is the largest in U.S. history and its effects are expected to last a number of years. Future year impacts will depend on additional information gained over time about the nature of the disaster and the response to it as well as the combined environmental, ecological, and quality of life effects of the spill and response. Such information will reduce the uncertainty regarding the disaster’s 2010 and subsequent years’ macroeconomic impacts. It is important to note that the impacts presented in this report are preliminary, but can assist in understanding the disaster’s effects while providing information that can help the state make claims for lost tax revenue for the year of the spill.
Samuel Addy, Ph.D. and Ahmad Ijaz
Center for Business and Economic Research
Culverhouse College of Commerce and Business Administration
The University of Alabama
June 2011
Summary
Introduction
The state of Alabama was hit by dozens of tornadoes on April 27, 2011 mainly in central and northern parts of the state that resulted in 240 lives lost and more than 2,200 injured to date. The resulting damage was so severe that 43 of the state’s 67 counties have been declared federal disaster areas. Several communities had major damage and a few had almost complete devastation. Nearly 14,000 homes were either totally destroyed or have been declared uninhabitable. Within urban communities, Tuscaloosa County was one of the worst hit, where an EF-4 tornado with winds of over 190 mph cut a path six miles long and half a mile wide through the middle of the city, completely leveling numerous businesses and residential communities. It is still quite early to fully comprehend the total economic effects of the damage caused by the tornadoes. However, enough information is now available to permit some preliminary estimates of damage effects on the Alabama economy with specific focus on employment, earnings, state finances, and gross domestic product (GDP).
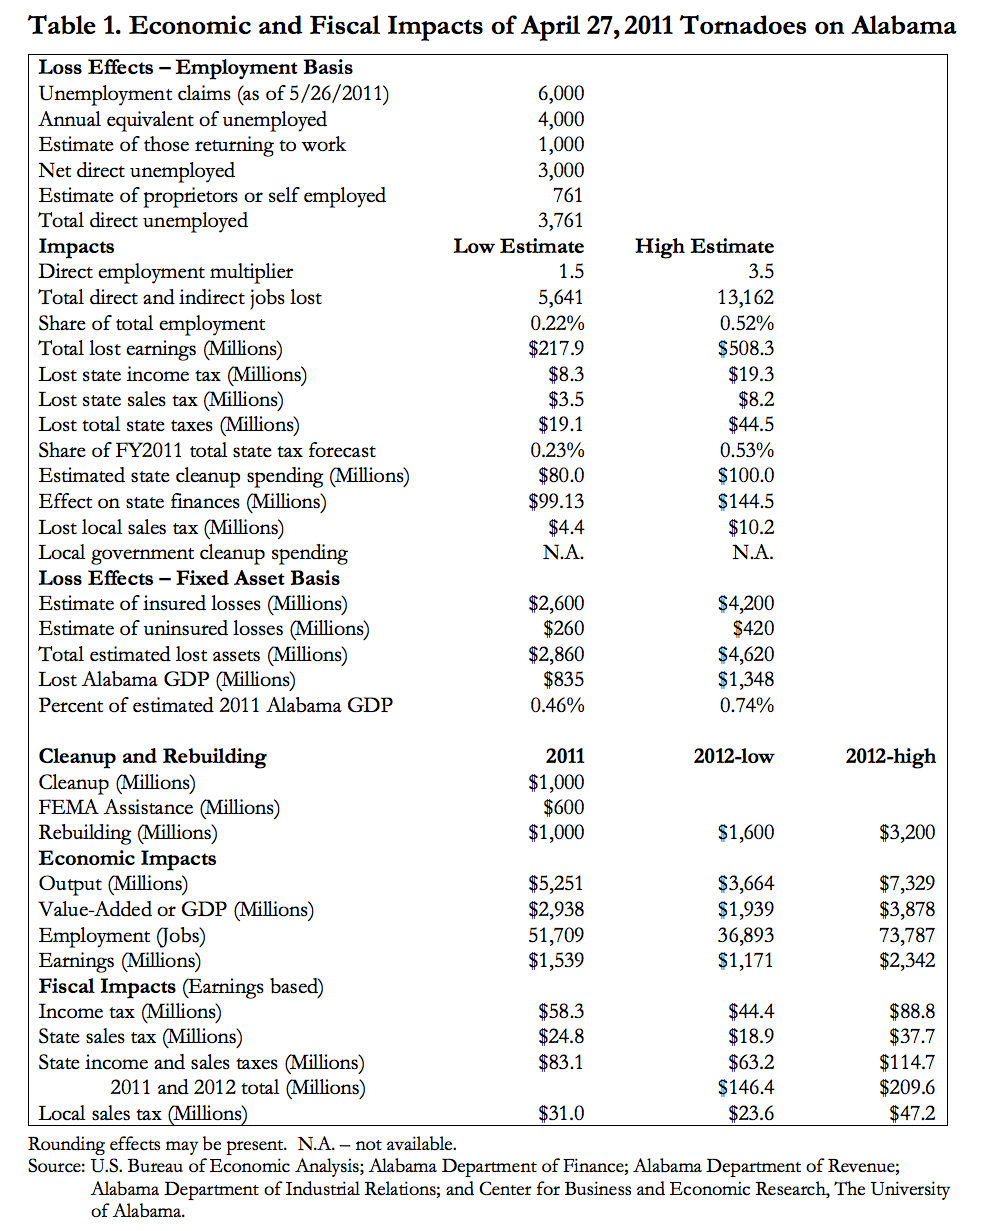
The purpose of this brief report is to present preliminary estimates of the economic and fiscal impacts of the tornadoes as well as the consequent recovery efforts on Alabama. Table 1 shows the preliminary impact analysis results. Multipliers obtained from the Regional Input-Output Modeling System (RIMS II), which was developed and is maintained by the U.S. Department of Commerce’s Bureau of Economic Analysis (BEA), were used in a model developed specifically for this analysis. To allow for uncertainty regarding the damage impacts at this early stage, low- and high-end estimates are presented. For impacts of recovery activities (cleanup, assistance, and rebuilding), multipliers used were for waste management and remediation services, accommodation, and construction industries.
Fiscal impacts are derived from the earnings impacts allowing for the fact that not all of the earnings impacts are sales or income taxable. Spending on sales taxable items constitute 42.4 percent of total earnings based on U.S. Bureau of Labor Statistics (BLS) data and state taxable income (net income) is about 66 percent of earnings. Sales tax rates used are 4.0 percent for the state and 5.0 percent for local (combined county and city) jurisdictions for a total of 9.0 percent; local sales tax rates vary between 3.0 to 7.0 percent but are usually at 5.0 percent. The state income tax rate is essentially 5.0 percent on net income; the first $500 and the next $2,500 are taxed at 2.0 percent and 4.0 percent, respectively, for single persons, head of family, and married persons filing separately while for married persons filing joint returns the first $1000 and the next $5000 are taxed at 2.0 percent and 4.0 percent, respectively, and excess net income is taxed at the 5.0 percent rate. Corporations pay at a 6.5 percent rate and corporate income tax averages about 15 percent of individual income tax. State law in 2006 increased the individual income tax threshold by increasing the standard deduction for taxpayers with adjusted gross income of $30,000 or less and by increasing the dependent exemption for taxpayers with adjusted gross income of $100,000 or less.
State sales and income taxes are the largest components (constituting about 62 percent) of total state tax collections; residents and businesses pay a host of other taxes and fees. The combined income and sales tax revenues share of total state tax receipts was used to determine the total lost state tax revenue for the damage impact analysis because job losses occurred across many different industries. No such determination is made on the recovery impacts because of the focus on just three industries; only sales and income taxes are reported and as such the recovery fiscal impacts are conservative.
This report would not have been possible without data from Alabama Department of Finance, Alabama Department of Industrial Relations (ADIR), Alabama Department of Revenue (ADOR), BEA, BLS, and newspaper reports. Many thanks are due to these agencies and newspaper publishers and also to our colleagues who assisted with completing this work. Major assumptions in the analysis are that:
Tornado Damage Impacts
Toward the end of May 2011, ADIR had received 6,000 claims for tornado-related unemployment and had data showing that some claimants were returning to work. Adjusting this number of claims received for the eight months remaining in the year after the devastation yields an annual equivalent of 4,000 unemployed. Assuming that a quarter of the claimants will return to work gets the number down to 3,000 net direct unemployed wage and salary workers. To this number we add a 761 estimate for proprietors or self employed based on BEA data and determine that the total direct number of unemployed due to the tornadoes is 3,761 for 2011. It is expected that these people will be working again in 2012.
The 3,761 direct unemployed must be added to tornado-related indirect employment to determine a total employment impact. Since businesses in numerous industries suffered the damages, it is improper to apply specific industry multipliers when that information is not currently available. Most Alabama industries’ direct effect employment multipliers are between 1.5 and 3.5 and so we used these multipliers to determine that the total direct and indirect number of tornadorelated unemployed is between 5,641 and 13,162. This is about 0.2-0.5 percent of total employment including proprietors. Average earnings for workers in 2011 are not much different from the 2009 earnings per worker level of $38,621, which means that $217.9-508.3 million in total earnings will be lost in 2011 because of the tornadoes. This translates into $19.1-44.5 million in lost state taxes, about 0.2-0.5 percent of the total. The lost state taxes comprise $8.3-19.3 million in income tax, $3.5-8.2 million in sales tax, and $7.3-17.0 million in other taxes. In addition, the state is expected to spend $80-100 million on cleanup and so for 2011 the tornadoes will cost the state $99.1-144.5 million. Local sales tax collections will also fall by $4.4-10.2 million in addition to whatever local governments have to spend on cleanup.
A fixed-asset basis is used to estimate the effect on Alabama GDP with the assumption that the state has the same GDP to fixed assets ratio of 29.2 percent as does the nation. Newspapers have reported a range of $2.6-4.2 billion expected insurance claims based on early estimates by Risk Management Solutions and AIR Worldwide. Assuming that the claims cover fixed assets only and allowing 10 percent extra for uninsured losses results in total estimated lost assets of $2.9-4.6 billion and a tornado-related 2011 Alabama GDP loss of $835 million to $1.3 billion or 0.5-0.7 percent.
The economic damage impacts are only a part of the full tornado damage impacts. There are other adverse effects on quality of life that we do not consider because these are non-market or non-economic effects. Examples include lives lost, displacement, mental and physical health issues, and the disruption to the lives of people who were not direct victims. Such quality of life aspects cannot be expressed with the variables used for impact analysis. In short, the damage impacts reported here are conservative.
Impacts of Recovery Activities
Based on the previously mentioned major assumptions, recovery activities will inject $2.6 billion into the Alabama economy in 2011 and $1.6-3.2 billion in 2012. The 2011 spending will create a $5.3 billion output or gross sales impact which includes a gain of $2.9 billion to the state’s GDP. Of the $2.9 billion value-added or GDP impact, $1.5 billion is earnings to 51,709 workers or $29,763 per worker. State income tax of $58.3 million and sales tax of $24.8 million for a total of $83.1 million will be generated along with local sales tax of $31.0 million. In 2012 the $1.6-3.2 billion spending on rebuilding will yield $3.7-7.3 billion in gross economic activity including a $1.9- 3.9 billion contribution to GDP. The earnings impact is $1.2-2.3 billion for 36,893-73,787 jobs at an average of $31,741 per job. Taxes generated are $63.2-126.5 million for the state ($44.4-88.8 million income tax and $18.9-37.7 million sales tax) and $23.6-47.2 million local sales tax.
Clearly the economic impacts of recovery activities are larger than those of the tornado damages. Some of the jobs created by recovery activities might go to people who became unemployed as a result of the tornadoes. It is important to note that the net effect is positive because most of the recovery funds are from external sources—the federal government and insurance claims. Those funds would have gone to some other use if the tornadoes had not struck or caused the devastation. As such, from a national perspective, the combined impact is negative. Additionally, there are the previously mentioned adverse effects on quality of life that if considered and valued could point to a net negative impact. If instead of rebuilding, the opportunity is taken to reinvest the net effect over time could turn positive. A specific example is just replacing a destroyed apartment building with (i) what was preexisting or (ii) something ranging from a larger (more units) and more energy efficient building to a totally different but better use of the space. The second choice is what will facilitate long term positive impacts.
Conclusions
For the Alabama economy, the April 27 tornadoes will initially reduce (i) GDP by $835 million to $1.3 billion or 0.5-0.7 percent, (ii) employment by about 5,600-13,200 jobs or 0.2-0.5 percent, (iii) state tax collections by $19.1-44.5 million or 0.2-0.5 percent, and (iv) local sales tax receipts by $4.4-10.2 million in 2011. Recovery activities (cleanup, assistance, and rebuilding) should pump $2.6 billion into the state economy in 2011 and $1.6-3.2 billion in 2012; state spending of about $80-100 million for cleanup in 2011 is expected. The federal government and insurance claims will fund most of the recovery. Cleanup and assistance should be completed in 2011, but rebuilding will continue into 2012.
Recovery activities will create economic impacts that exceed those of the tornado damage. For 2011 recovery impacts include gains of $2.9 billion in GDP or 1.6 percent, 51,700 jobs with $1.5 billion in earnings for an average of $29,763 per worker, $83.1 million in state income and sales taxes, and $31.0 million in local sales tax collections. The 2012 rebuilding impacts are 36,893-73,787 jobs with $1.2-2.3 billion in earnings or $31,741 per worker, $1.9-3.9 billion in GDP, $63.2-126.5 million in state income and sales taxes, and $23.6-47.2 million in local sales tax receipts.
Over the two years, recovery activities will generate enough revenue to cover damage-induced losses to state finances as well as the state spending for cleanup if assumptions on losses and spending hold. While the tornadoes’ damages are largely localized, the economic impacts of the ensuing recovery activities will be more widespread. Some areas were so devastated that it is nearby communities that will benefit from the recovery spending. This report focuses only on the identified economic effects, and not on other very important quality of life factors such as lives lost, displacement, mental and physical health issues, and disruption to the lives of people who were not direct victims. Incorporating these other factors and the opportunity cost of recovery spending leads to the conclusion that the tornadoes could have had a net negative effect on the state; the effect nationally is definitely negative. Overcoming this negative effect will require going beyond rebuilding to reinventing and reinvesting.
TUSCALOOSA, Ala. — In honor of Veteran’s Day, UA’s Center for Business and Economic Research compiled some interesting statistics about veterans in Alabama. Veterans make up a significant portion of Alabama’s population, with about 9.8 percent of Alabama’s population identifying as a veteran, according to the U.S. Census Bureau’s 2011‐2015 American Community Survey estimates. Data from the U.S. Department of Veteran Affairs estimates about 370,000 veterans live in Alabama as of September 30, 2017. By examining the demographic characteristics, educational attainment, and entrepreneurship of veterans in Alabama, we can appreciate the diversity of veterans and the impact they have on their local communities.
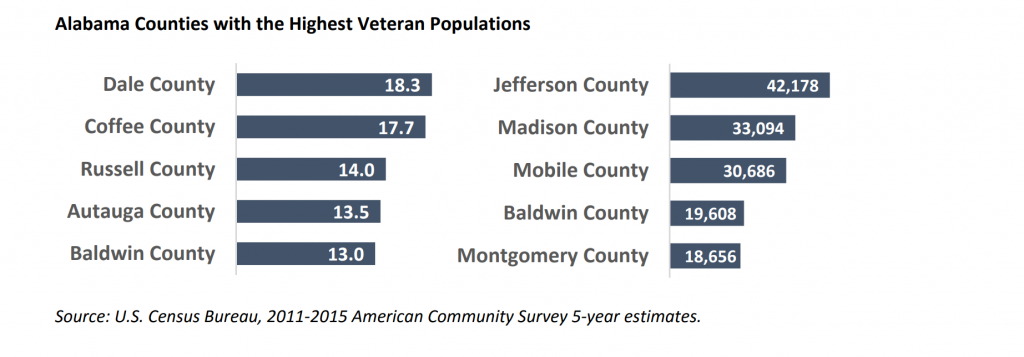
Alabama veterans live throughout the state, but there are several counties that seem to be favorites for those who served in the armed forces. According to the U.S. Census Bureau’s 2011‐2015 American community Survey (ACS) estimates, Dale County has the highest percentage population of veterans at 18.3 percent. Coffee County follows closely, with 17.7 percent of its population identifying as veterans. Russell, Autauga, and Baldwin counties all have veteran populations larger than 12.0 percent of their total population.
Looking at the number of veterans living in a county, we see many veterans living in the more populated counties. According to the same ACS data set, Jefferson County has the largest population of veterans in the state, with about 42,000 veterans calling the county their home. Madison County also has a significant population of veterans (33,094), as does Mobile County (30,686). Baldwin and Montgomery counties both have large veteran populations at 19,608 and 18,656, respectively.
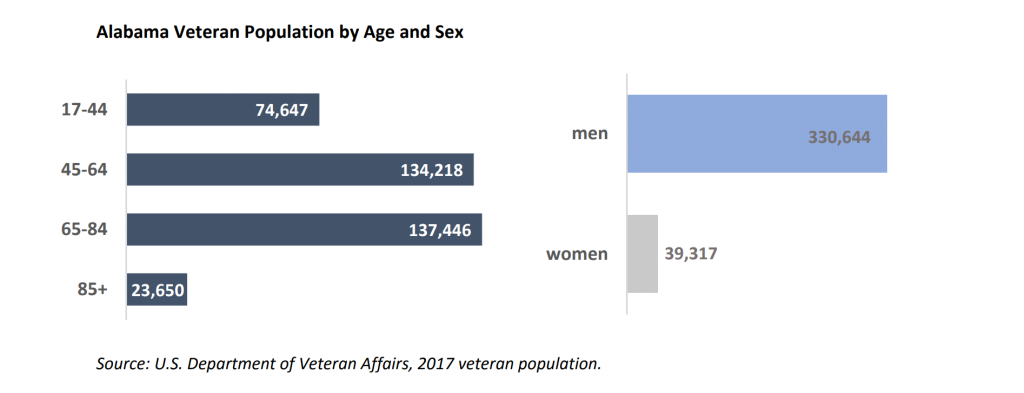
About a fifth of Alabama veteran population in 2017 are 17 to 44 years old, according to the U.S. Department of Veteran Affairs. More than a third or 36.3 percent are 45 to 64 years old, 37.2 percent are 65 to 84 years old, and 6.4 percent are 85 and over. Most of veteran population in the state are men (89.4 percent) while 10.6 percent are women.
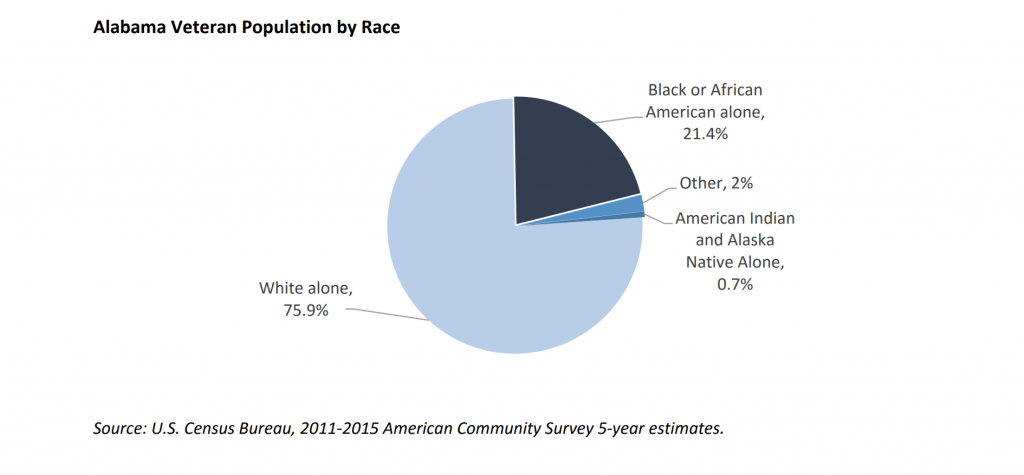
According to the U.S. Census Bureau’s ACS data, 21.4 percent of Alabama veterans identify as Black or African American; 0.7 percent identify as American Indian or Alaska Native alone; and a 75.9 percent majority of veterans living in Alabama identify as White alone. Additionally, 1.5 percent of Alabama veterans identify as Hispanic or Latino of any race.
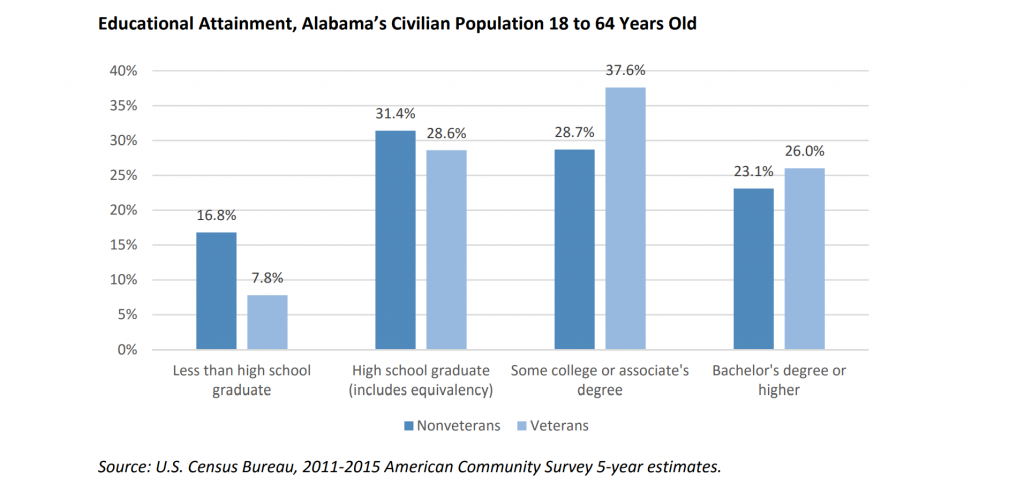
In Alabama, veterans tend to be more educated than nonveterans. Using estimates from the U.S. Census Bureau, you can see that a greater percentage of veterans than Alabama’s nonveteran population have at least a bachelor’s degree, and a larger portion of the veteran community has some college or associate’s degree than the nonveteran population. Additionally, a smaller percentage of veterans have less than a high school graduate’s level of education than the nonveteran population.
 Entrepreneurship
 According to the most recent U.S. Census Bureau’s Annual Survey of Entrepreneurs (2015), among 66,691 Alabama firms, 9.6 percent or 6,425 were veteran‐owned and 3.3 percent or 2,201 firms were equally veteran‐/nonveteran‐owned. Veteran‐owned firms employed 68,669 people and had an annual payroll of almost $2.5 billion. Firms that were equally veteran‐ and nonveteran‐owned employed 20,946 people and had an annual payroll of $562.2 million.
Firms in educational services had the largest share of veteran‐owned firms: 16.4 percent or 117 out of 713 firms. The largest share of equally veteran‐/nonveteran‐owned firms was in mining, quarrying, and oil and gas extraction sector, with 14.3 percent or 17 out of 119 firms. Retail trade industry had the largest number of veteran‐owned firms: 1,103 companies. The largest number of equally veteran‐ /nonveteran‐owned firms was also in retail trade, with 362 companies.
Contact: Viktoria Riiman, Socioeconomic Analyst, Culverhouse College of Commerce, Center for Business and Economic Research (CBER), 205‐348‐3757, vriiman@cba.ua.edu; Susannah Robichaux, Socioeconomic Analyst, Culverhouse College of Commerce, CBER, 205‐348‐3781, scrobichaux@cba.ua.edu