

BP Oil Spill Preliminary Macroeconomic Impacts on Alabama
- July 24th, 2019
Samuel Addy, Ph.D. and Ahmad Ijaz
Center for Business and Economic Research
Culverhouse College of Commerce and Business Administration
The University of Alabama
September 2010
Summary
This report presents preliminary macroeconomic impact estimates of the BP Deepwater Horizon oil spill on Alabama for 2010. The purpose is to provide some sense of the effect of the disaster on the state and to provide information that can help the state make claims for resulting lost tax revenue in the first year. We consider only macroeconomic impacts and not (i) micro impacts that businesses and individuals can use for making claims or (ii) environmental, ecological, and noneconomic quality of life impacts that contribute to determining the full effects of the disaster.
Four scenarios for impact estimates are considered in a sensitivity analysis to account for the uncertainty regarding such disaster estimates, especially since the year is not yet over. The scenarios involve different loss effects on tourism and fishing activities in the state from year 2008 levels. The worst case assumes 30 percent and 80 percent annual net loss on tourism and fishing, respectively; the optimistic case involves corresponding losses of 7.5 percent and 50 percent.
In the worst case the oil spill results in losses of $3.3 billion in Alabama economic output, $971 million in earnings, and nearly 49,000 jobs for 2010. Individuals and businesses could make $1.6 billion in claims and state and local governments could make a collective $149 million claim for lost tax revenues. The optimistic case results in (i) losses of about $1.0 billion in economic output, $284 million in earnings, and 13,600 jobs and (ii) claims of $463 million for individuals and businesses and $41 million for state and local government.
The oil spill’s effects are expected to last a number of years. Future year impacts will depend on additional information gained about the nature of the spill and the response and their combined environmental/ecological and quality of life effects. Such information will reduce the uncertainty regarding the disaster’s 2010 and subsequent years’ macroeconomic impacts.
Introduction
On April 20, 2010 the Deepwater Horizon oil drilling rig exploded in the Gulf of Mexico and resulted in 11 deaths, 17 injured, and a gush of about 53,000 barrels of crude oil per day from the seabed. Response to the spill involved containment, dispersal, removal and some burning, and a moratorium on deep offshore drilling activities. The gushing oil was stopped on July 15, 2010 by capping the Macondo well from which it was flowing. While the official flow rate has established the spill as the largest in U.S. history, there is still some uncertainty regarding the flow rate and total amount spilled. The U.S. government considers BP to be the responsible party for the disaster and has negotiated a $20 billion fund—which is not a cap and has the company’s U.S. assets as bond until fully paid for—to be used for purposes that include government response expenditures and claims from affected parties. There is significant uncertainty regarding the effects of this event and the response to it on the environment, ecology, economies, and people of the region. Determining the full impacts of the oil spill will take time, but there are immediate needs and claims that must be paid as the spill generated ongoing adverse effects on the economies and people of the region.
Comprehensive studies of the impacts of disasters such as the oil spill are complex because they must consider tangible and intangible effects on the environment, ecology, and quality of life along four dimensions (visibility, spatial, time, and distributional). The environmental and ecological effects need to be studied over time because of the dynamics of biological, chemical, and physical processes that help in determining effects on the environment, wildlife, food chain, toxicity issues, and ecosystems in general. Indeed, scientists are yet to fully account for the oil that gushed out, a question of inventory. Quality of life effects must cover economic impacts at micro and macro levels as well as social, cultural, psychological, health, political, and other issues. The visibility dimension demands considering direct, indirect, visible, and invisible impacts. The spatial dimension requires a look at distance, direction, and depth (surface, underwater, and above surface) impacts. The time dimension focuses attention on the pace and intensity of impacts. The fourth and final dimension, distributional, necessitates the determination of who and what systems are affected, how they are affected and by how much, and whether and how they should be compensated.
The motivation for this work comes from the need to understand somewhat the effect of the disaster on Alabama and to facilitate claims to recover losses due to the oil spill’s ongoing adverse effects on the state economy. The impacts presented in this report are just a small slice of the full impacts on Alabama and are preliminary macroeconomic impacts of the spill for 2010 only. We do not address (i) subsequent year impacts, (ii) micro impacts that businesses and individuals can use for making claims, or (iii) environmental, ecological, and noneconomic quality of life impacts. To deal with the uncertainty that disaster impact studies have to contend with, we use a sensitivity analysis on key variables—the net loss factors to tourism and fishing activities—that the oil spill causes. Our results provide some sense of the effect of the disaster on the state’s economy and hopefully provide an objective, reliable, and transparent analysis that the state can use to make a claim for lost state and local tax revenue in 2010.
Analysis and Results
Given that the oil spill was offshore and impacted coastal areas, one would expect that the spill’s direct and initial effects will be principally on tourism (which includes recreational fishing), commercial fishing, and water transportation. The interaction between these economic activities and the rest of the economy will result in indirect effects which must be combined with the direct effects to determine the macroeconomic impacts. This requires the use of economy-wide methodologies to determine impacts. Methods used in estimating economic impacts include econometric, economic base, computable general equilibrium (CGE), and input-output (I-O) models. Econometric and CGE models can be very costly and time-consuming to build and economic base models require a very detailed set of information that is sometimes not available. These three methodological approaches generate slightly smaller multipliers than I-O models because of assumptions on factors such as input substitution and optimization behavior by economic agents (consumers, businesses, and governments). The I-O modeling technique, which generates multipliers for economic activities of interest by focusing on economic interactions among all industries and all other economic transactions in a specified region, was used in this study. The multipliers used were obtained from the Regional Input-Output Modeling System (RIMS II), which is developed and maintained by the U.S. Department of Commerce’s Bureau of Economic Analysis. RIMS II is available for the nation, states, metro areas, and counties as well as for geographic areas for which enough information exists to construct a model.
To allow for uncertainty regarding disaster estimates and especially since we focus on estimates for 2010 while the year is not over, we consider four scenarios in a sensitivity analysis on losses to the directly affected economic activities. The scenarios involve different net loss effects on tourism and fishing activities in the state from year 2008 levels; we assume no losses for water transportation since we are unaware of any such reports, not even anecdotally. The base year of 2008 is the most recent year for which we could assemble a complete set of data for the analysis. The worst case assumes 30 percent and 80 percent annual net loss on tourism and fishing, respectively; the optimistic case involves corresponding losses of 7.5 percent and 50 percent. A “somewhat likely” scenario considers 20 percent tourism loss and 80 percent fishing loss and a “very likely” scenario looks at 15 percent tourism loss and 50 percent fishing loss. We use these net loss factors to determine the direct economic effects on Alabama tourism and fishing and then apply the RIMS II multipliers to generate impacts on state economic output, earnings, and employment.
Fiscal impacts are derived from the earnings impacts allowing for the fact that not all of the earnings impacts are sales or income taxable. Spending on sales taxable items constitute 42.4 percent of total earnings and state taxable income (net income) is about 66 percent of earnings. The state income tax rate is generally 5.0 percent on net income; the first $500 and the next $2,500 are taxed at 2.0 percent and 4.0 percent, respectively, for single persons, head of family, and married persons filing separately while for married persons filing joint returns the first $1000 and the next $5000 are taxed at 2.0 percent and 4.0 percent, respectively. Excess net income is taxed at the 5.0 percent rate. Corporations pay at a 6.5 percent rate and corporate income tax is quite stable at about 15 percent of individual income tax. Sales tax rates used are 4.0 percent for the state and 5.0 percent for local (combined county and city) jurisdictions for a total of 9.0 percent. Local sales tax rates vary between 3.0 to 7.0 percent among Alabama counties, but are most frequently at 5.0 percent. State law in 2006 increased the individual income tax threshold by increasing the standard deduction for taxpayers with adjusted gross income of $30,000 or less and by increasing the dependent exemption for taxpayers with adjusted gross income of $100,000 or less. The Education Trust Fund (ETF) portion of state income and sales taxes is determined. Alabama residents pay a host of other taxes and fees, but sales and income taxes are the largest components of taxes paid. The combined income and sales tax revenues share of total state tax receipts is thus used to determine the maximum total state tax revenue lost for each scenario and a similar derivation is made for the ETF.
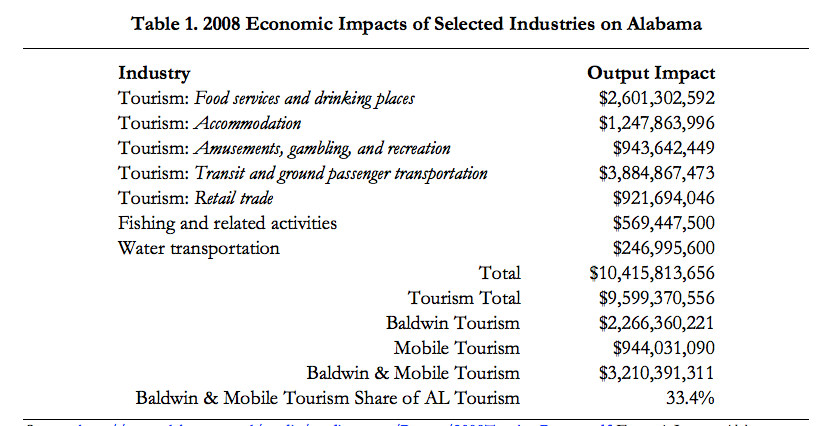
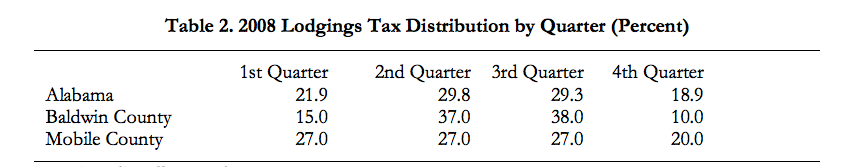
Table 1 shows the 2008 economic impacts of Alabama tourism, fishing, and water transportation on the state. Tourism activities take place within the five industries listed first, but do not account for all of those industries’ impacts on the state; only the tourism component impacts are shown. Tourism in 2008 had a $9.6 billion impact on Alabama, with $3.2 billion or 33.4 percent coming from the two Gulf Coast counties, Baldwin and Mobile. This suggests that the absolute theoretical worst case for Alabama tourism is a 33.4 percent impact loss. Using RIMS II multipliers we estimate impacts of $569.5 million for fishing and $247 million for water transportation. Alabama would have taken a $10.4 billion hit if the oil spill had wiped out all the impacts in the table. Water transportation was not affected to our knowledge, fishing lost at least one major season out of two annually, and tourism was not wiped out—although it was severely impacted—in the two coastal counties. Mardi Gras occurred before the spill, other inland tourism activities continued, and cleanup activities following the spill provided some income generating opportunities for fishermen. Table 2 shows that the explosion of the rig and the capping of the well took place in the two quarters that provide most lodgings tax revenues for Alabama and its coastal counties. We used the lodgings tax distribution to come up with the “somewhat likely” scenario while holding fishing losses at the “worst case” 80 percent level. The “very likely” scenario allows for a salvaging of one major fishing season for a 50 percent loss and half the worst case tourism loss. The “optimistic” scenario halves the tourism loss in the “very likely” scenario while keeping the fishing loss level.
Travel Industry 2008; U.S. Department of Commerce, Bureau of Economic Analysis; and Center for Business and
Economic Research, The University of Alabama.
Source: http://www.alabama.travel/media/media_room/Report/2008TourismReport.pdf Economic Impact: Alabama
Travel Industry 2008.
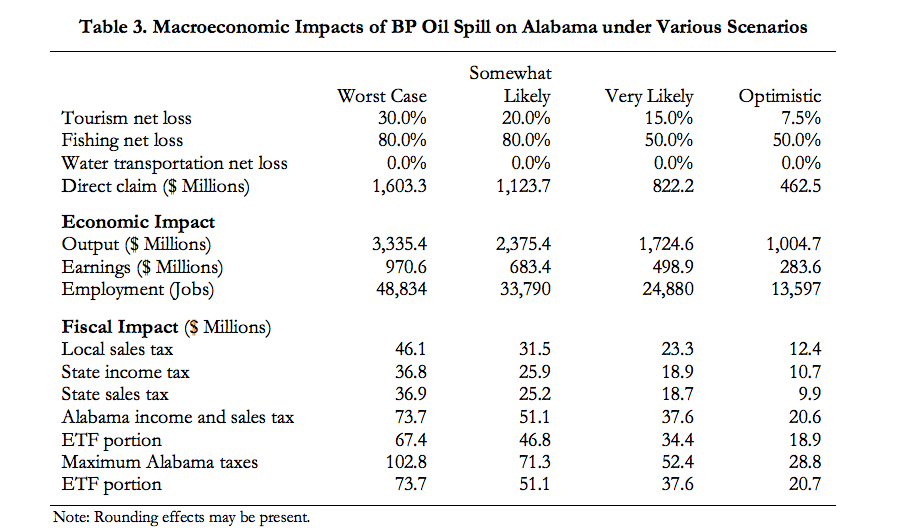
The macroeconomic impacts for each scenario of loss in 2010 are shown in Table 3. In the worst case we adjust theoretical maximum losses of 33.4 percent to tourism and 100 percent to fishing and allow for some tourism and fishing activities prior to the explosion of the rig as well as income generated from cleanup activities to arrive at a 30 percent tourism loss and 80 percent fishing loss. Under this scenario, the oil spill results in losses of $3.3 billion in Alabama economic output, $971 million in earnings, and nearly 49,000 jobs for 2010. Accompanying fiscal impacts are reduced revenues of $46.1 million in local sales tax, $36.8 million in state income tax, and $36.9 million in state sales tax. Of the combined $73.7 million in state income and sales taxes, $67.4 million will be lost to the ETF. State income and sales taxes constitute 72 percent of total state tax collections and suggest that the state could see a maximum loss of $102.8 million if proportionate reductions in all other state tax revenues occur. Similarly, income and sales taxes constitute 92 percent of ETF receipts and thus the fund could see a maximum loss of $73.7 million. The direct loss amount that results in these impacts is $1.6 billion and thus individuals and businesses could make claims totaling that amount. This direct claim amount would be for lost revenues and income and also any damage to property, but not for other tangible or intangible environmental, ecological, and noneconomic quality of life impacts. State and local governments could make a combined $149 million claim for lost tax revenues.
The somewhat likely case of a 20 percent tourism net loss and 80 percent fishing net loss in 2010 results in adverse impacts of (i) $2.4 billion in economic output, $683.4 million in earnings, 33,790 jobs, $31.5 million in local sales tax, $51.1 million in state income and sales taxes as part of a possible $71.3 million total in state tax receipts, $46.8 million in ETF income and sales tax receipts with a possible maximum of $51.1 million to the fund and (ii) claims of $1.1 billion for individuals and businesses and $102.8 million for state and local government.
Revenue; and Center for Business and Economic Research, The University of Alabama.
The very likely scenario of a 15 percent tourism net loss and 50 percent fishing net loss in 2010 yields adverse impacts of (i) $1.7 billion in economic output, $498.9 million in earnings, 24,880 jobs, $23.3 million in local sales tax, $37.6 million in state income and sales taxes as part of a possible $52.4 million total in state tax receipts, $34.4 million in ETF income and sales tax receipts with a possible maximum of $37.6 million to the fund and (ii) claims of $822.2 million for individuals and businesses and $75.8 million for state and local government. In the optimistic case of a 7.5 percent tourism net loss and 50 percent fishing net loss, the impacts are reductions of $1.0 billion in economic output, $283.6 million in earnings, 13,597 jobs, $12.4 million in local sales tax, $20.6 million in state income and sales taxes as part of a possible $28.8 million total in state tax receipts, $18.9 million in ETF income and sales tax receipts with a possible maximum of $20.7 million to the fund, and claims of $462.5 million for individuals and businesses and $41.2 million for state and local government.
Conclusions
In this report we have attempted to provide some sense of the effect of the BP Deepwater Horizon oil spill on Alabama for 2010 under four different scenarios. The scenarios considered suggest that the oil spill may have reduced Alabama’s economic output by $1.0 billion to $3.3 billion in 2010 and involved losses of $284 million to $971 million in earnings and 13,600 to 49,000 jobs. Individuals and businesses could make direct claims for lost revenues, income, and property damage of between $463 million and $1.6 billion and a combined claim of $41 million to $149 million can be made for lost state and local tax revenues. We considered only macroeconomic impacts and not (i) micro impacts that businesses and individuals can use for making claims or (ii) environmental, ecological, and noneconomic quality of life impacts that contribute to determining the full effects of the disaster.
The oil spill is the largest in U.S. history and its effects are expected to last a number of years. Future year impacts will depend on additional information gained over time about the nature of the disaster and the response to it as well as the combined environmental, ecological, and quality of life effects of the spill and response. Such information will reduce the uncertainty regarding the disaster’s 2010 and subsequent years’ macroeconomic impacts. It is important to note that the impacts presented in this report are preliminary, but can assist in understanding the disaster’s effects while providing information that can help the state make claims for lost tax revenue for the year of the spill.