The study analyzes COVID-19 vaccination disparities across 360 counties in four U.S.–Mexico border states, highlighting how geographic location, socioeconomic conditions, demographic characteristics, and political affiliation shaped vaccination and booster uptake. Using multivariable regression analysis and GIS mapping, the research provides evidence-based insights to support more targeted, context-specific public health strategies to reduce health disparities and improve vaccination coverage in border communities.
Learn more about how the Center for Business and Economic Research can help you with your research questions here. Our population and forecasting models can be applied to produce forecasts for specified geographic areas or prepare demographic profiles. We can also customize econometric models to analyze the economic impact of an industry or a major economic event on an area. Feel free to reach out to the general number or a specific staff member for more information.
Alabama’s total population grew by 167,651 residents between April 1, 2020 and July 1, 2025, reaching 5,193,088. Annual growth peaked during 2023–2024 at 0.88 percent, with a comparable growth rate of 0.81 percent between 2022 and 2023. Migration, particularly domestic migration, reflecting residents relocating to Alabama from other states, has been the primary driver of population growth throughout the period.
The most recent year reveals emerging demographic headwinds. A broad national slowdown in international migration has also affected Alabama, with international migrants declining from 15,763 in 2023–2024 to 8,946 in 2024–2025, which is a drop of 6,817 migrants, or 43.7 percent. This sharp contraction in international migration contributed to downward population pressure in the state’s most recent estimate period, tempering what had been an accelerating growth trajectory.
Despite this recent deceleration in population growth, Alabama’s five-year growth trend remains solid, exceeding the national average. However, growth is uneven and is concentrated in a handful of metropolitan areas.
Figure 1. Alabama Total Population, April 2020–July 2025
Source: U.S. Census Vintage 2025 Population Estimates, analysis conducted by CBER.
Alabama’s Population Growth Compared to Other States
Alabama’s 3.34 percent cumulative growth rate between 2020 and 2025 exceeded the national rate of 3.10 percent but ranked ninth among the Census-defined region of the South, which comprises 16 south-eastern states and the District of Columbia. This region grew at 5.98 percent — nearly double Alabama’s pace — led by Florida (8.93%), South Carolina (8.83%), and Texas (8.78%), each sustained by high and consistent in-migration flows.
No comparison better illustrates Alabama’s relative rank than South Carolina. In 2010, Alabama’s population of 4,779,736 exceeded South Carolina’s 4,625,364 by 154,372 residents. By the 2020 Census, the two states populations diverged, and by July 2025, South Carolina’s population surpassed Alabama’s population by 377,186 residents, having grown at a rate more than two-and-a-half times faster over the 2020–2025 period.
Yet Alabama’s trajectory remains positive. Despite the widening gap with South Carolina, the state consistently added residents each year — a distinction not shared by Mississippi, Louisiana, and West Virginia, the only Southern states to record population losses since 2020.
Figure 2.Alabama Outpaces the Nation but Trails Most Southern Peers in Population Growth, 2020–2025
Source: U.S. Census Vintage 2025 Population Estimates, analysis conducted by CBER.
Figure 3 plots each U.S. state by its natural change rate (horizontal axis) and net migration rate (vertical axis) between 2020 and 2025, revealing the two demographic forces driving — or constraining — population change across the country. Southern states and the District of Columbia are labeled; the remaining states appear as unlabeled grey dots.
Alabama, distinguished in black, sits in the upper-left quadrant: natural decrease paired with positive net in-migration. Between 2020 and 2025, Alabama recorded 303,445 births against 331,008 deaths — a natural decrease of 27,563 residents. Net migration of 195,050 more than offset that loss, producing the state’s overall net gain of 167,651 residents. Domestic migrants accounted for 141,048 of that total, or 72.3 percent, with international migrants contributing the remaining 54,002. Alabama’s population dynamics are shared by several Southern states, including Florida, South Carolina, Tennessee, Delaware, Kentucky, and Arkansas, where deaths now outpace births, but in-migration more than compensates for the downward pressure of relatively high death rates on overall population change.
Alabama fared better than Louisiana, where the state’s population dynamics are the inverse of Alabama’s dynamics, in which there were more births than deaths, but net negative migration. In comparison, similar to Alabama, Mississippi and West Virginia experienced natural decrease; however, in-migration was too modest to compensate for the excess deaths over births, resulting in cumulative population decline over the period.
Figure 3.Migration Is Key to Population Growth in Alabama and Across Most U.S. States, 2020–2025
Source: U.S. Census Vintage 2025 Population Estimates, analysis conducted by CBER.
Population Growth by County
Alabama’s statewide growth obscures dramatic heterogeneity across its 67 counties. In absolute terms, Madison County led all counties with a net gain of 45,358 residents between 2020 and 2025, followed by Baldwin (35,983), Limestone (19,365), Lee (15,544), and Shelby (15,521). These five counties alone accounted for 131,771 residents — nearly 79 percent of Alabama’s entire statewide net population gain of 167,651, underscoring the geographic concentration of the state’s population growth.
In contrast, Jefferson County recorded the largest numerical loss at −8,588 residents, followed by Dallas (−3,325), Mobile (−3,154), and Montgomery (−3,062) counties. Alone, these four counties accounted for nearly 11 percent of all county-level population losses recorded over the period. Among Alabama’s 67 counties, 34, or just over half of all counties, recorded net population losses between 2020 and 2025, even as the statewide total continued to grow.
Figure 4. Numeric Population Change Across Alabama’s 67 Counties, 2020–2025
Source: U.S. Census Vintage 2025 Population Estimates, analysis conducted by CBER.
Across Alabama’s 67 counties, Figure 5 shows that the rate of population change ranges from nearly 19 percent growth to nearly a 13 percent decline — a 32-percentage-point spread that captures the magnitude of the state’s demographic divide.
Limestone County reported the highest growth rate at 18.7 percent, which is nearly five times the statewide rate of 3.3 percent, reflecting rapid in-migration. Baldwin (15.5%) and Madison (11.7%) round out the top three, each driven by strong and sustained domestic in-migration. Of the 67 counties, 33 grew faster than the statewide rate of 3.3 percent, while 34 grew more slowly or recorded outright population losses from 2020 to 2025.
Among counties with the steepest rate of decline, most are in Alabama’s Black Belt region. Perry (−12.8%) and Lowndes (−9.3%) recorded the steepest losses in the state. Figure 5 also illustrates significant proportional decline among small, rural counties. For example, Macon (−7.2%), Greene (−8.6%), Dallas (−8.6%), and Wilcox (−8.8%) each recorded population losses representing a substantial share of their relatively small 2020 base populations. Conecuh (−6.0%), Choctaw (−6.0%), and Sumter (−6.1%) also recorded notable declines.
Figure 5. Rate of Population Change Across Alabama’s 67 Counties, 2020–2025
Source: U.S. Census Vintage 2025 Population Estimates, analysis conducted by CBER.
Figure 6 illustrates all 67 Alabama counties by their natural change rate (horizontal axis) and net migration rate (vertical axis) between 2020 and 2025, highlighting the two demographic forces shaping population change at the county level. The quadrant structure organizes counties into four distinct demographic profiles based on the direction of each force.
Nine counties sit in the upper-right quadrant, recording both positive natural increase and net in-migration —dual population growth forces. Limestone, Madison, and Lee counties anchor this group, each benefiting from younger age structures and relatively high in-migration flows. The upper-left quadrant is the modal category, which consists of counties with a demographic profile similar to the state, where natural decrease (more deaths than births) offset by sufficient in-migration to yield net population gains.
All the counties in the lower-left quadrant experienced both natural decrease and net out-migration. Montgomery stands alone in the lower-right quadrant — the only county, in Alabama, that had natural increase alongside net out-migration.
Figure 6. Most Alabama Counties Experience Natural Decrease, but Migration is the key to Population Growth, 2020-2025
Source: U.S. Census Vintage 2025 Population Estimates, analysis conducted by CBER.
Figure 7 tracks shifts in county population rankings across Alabama’s 67 counties between April 2020 and July 2025, with black lines indicating counties that rose in rank, red lines indicating counties that fell, and grey lines indicating counties whose population rank remained unchanged over the period.
Henry County recorded the most dramatic upward rank of any county, climbing four positions from the 51st largest county to the 47th largest. Limestone and Autauga each rose two positions, while Randolph and Cleburne also gained two ranks — all reflecting sustained in-migration over the period. Jefferson, Baldwin, Morgan, Lee, and 28 other counties held their rankings entirely unchanged from 2020 to 2025.
The sharpest declines belong to Russell and Macon, each falling three positions, followed by Montgomery and Dallas, which each dropped by two ranks. Montgomery’s fall from 5th to 7th is notable, given that it is the only county in the state with a natural increase, but negative net migration. Mobile dropped one position, falling from 2nd to 3rd as Madison County’s rapid growth pushed it to now be the state’s second largest county.
Figure 7. Shifts in Alabama County Population Rankings, 2020–2025
Source: U.S. Census Vintage 2025 Population Estimates, analysis conducted by CBER.
Population Growth by MSA
Figure 8 shows that Huntsville MSA recorded the largest absolute gain of any Alabama metro at 64,723 residents, or a growth rate of 13.2 percent. The Huntsville MSA only consists of two counties (Madison and Limestone), and it is the second largest MSA in the state with a total population at 556,444 residents. The Daphne-Fairhope-Foley MSA reported the highest growth rate at 15.5 percent, adding 35,983 residents, and has a population estimate of 267,761.
Birmingham, Alabama’s largest MSA, spans six counties, and has a population of nearly 1.2 million, but only added 17,134 residents — a modest 1.5 percent gain relative to the size of the metro.
The growth of the Birmingham MSA is largely driven by the growth of two counties in the MSA– Shelby and St. Clair. Auburn-Opelika (7.3 percent) and Tuscaloosa (4.5 percent) also recorded solid growth, driven in part by the presence of large and growing state universities.
The Mobile MSA had the largest population loss among all the metros, losing 3,154 residents, or a decline of 0.8 percent. Anniston-Oxford also loss population, falling by 605 residents (-0.5 percent). The Montgomery MSA, which includes four counties, recorded marginal growth of just 2,697 residents, or 0.7 percent, with Autauga and Elmore counties driving the MSA’s growth.
Figure 8. Total Population and Population Change among Alabama’s 12 Metropolitan Statistical Areas, 2020–2025
Source: U.S. Census Vintage 2025 Population Estimates, analysis conducted by CBER.
Figure 9 reveals that the Daphne-Fairhope-Foley MSA recorded the highest net migration rate among all Alabama metros despite having more deaths than births. The Huntsville MSA recorded the second-highest net migration rate and sits in the upper-right quadrant, and it is one of four metros that recorded both positive natural increase and positive net in-migration from 2020 to 2025. Florence-Muscle Shoals, Dothan, and Decatur cluster in the upper-left quadrant with modest positive migration rates offsetting natural decrease.
The Mobile MSA is the only metro in the lower-right quadrant, with more deaths than births paired with net out-migration. Anniston-Oxford, also shown in red, has more people moving into the MSA than out, but it sits just slightly above the migration axis, and the MSA’s steep rate of natural decrease, results in cumulative population loss over the five-year period.
Figure 9.Natural Change Rate and Net Migration Rate, Alabama Metropolitan Statistical Areas, 2020–2025
Source: U.S. Census Vintage 2025 Population Estimates, analysis conducted by CBER.
Conclusion
In summary, this analysis unravels a consistent story about Alabama’s demographic trajectory between 2020 and 2025. The state grew by 167,651 residents and outpaced the national average, but that growth was not evenly distributed as more than half of Alabama’s 67 counties loss population over the period, and natural decrease (more deaths than births) was the norm across many counties and metropolitan areas. Migration was the key engine of statewide population gain, concentrated in a small number of high-growth counties and selected metropolitan areas that benefited from high rates of domestic in-migration.
Analysis and text by Nyesha Black, Ph.D., Director of Demographics and Socioeconomic Analysis at CBER.
CBER’s Director of Demographics and Socioeconomic Analysis, Dr. Nyesha C. Black, recently released an updated brief examining the State of Microbusinesses in Alabama. The report analyzes establishment trends, payroll activity, employment patterns, and industry distribution among the state’s smallest firms using data from the U.S. Census Bureau’s County Business Patterns (CBP).
A microbusiness is defined as an employer establishment with fewer than 10 employees. According to the latest data, Alabama had 74,232 microbusiness establishments in 2023, representing 70.2 percent of all employer establishments statewide. These firms collectively supported 237,053 jobs and generated $11.4 billion in payroll, demonstrating the significant role that very small businesses play in Alabama’s economy.
Microbusiness activity is widely distributed across industries, though it is most concentrated in retail trade, professional services, health care and social assistance, construction, and other service-based sectors. Retail trade alone accounted for 12,602 microbusiness establishments, or 17 percent of all microbusinesses in the state.
While microbusinesses are smaller in scale than larger firms, they remain a foundational component of Alabama’s economic structure — supporting local employment, entrepreneurship, and business diversity across communities throughout the state.
More details can be found in the State of Microbusinesses in Alabama updated report here. All questions and inquiries can be directed to Dr. Nyesha Black at ncblack@ua.edu.
The University of Alabama’s Center for Business and Economic Research is the lead Alabama State Data Center (ASDC) organization, but the network also includes some amazing affiliates with a wide range of expertise. Each year, we compile a report detailing all of the work being done throughout the state on behalf of the network. This year, twelve affiliates responded, and the numbers are really impressive!
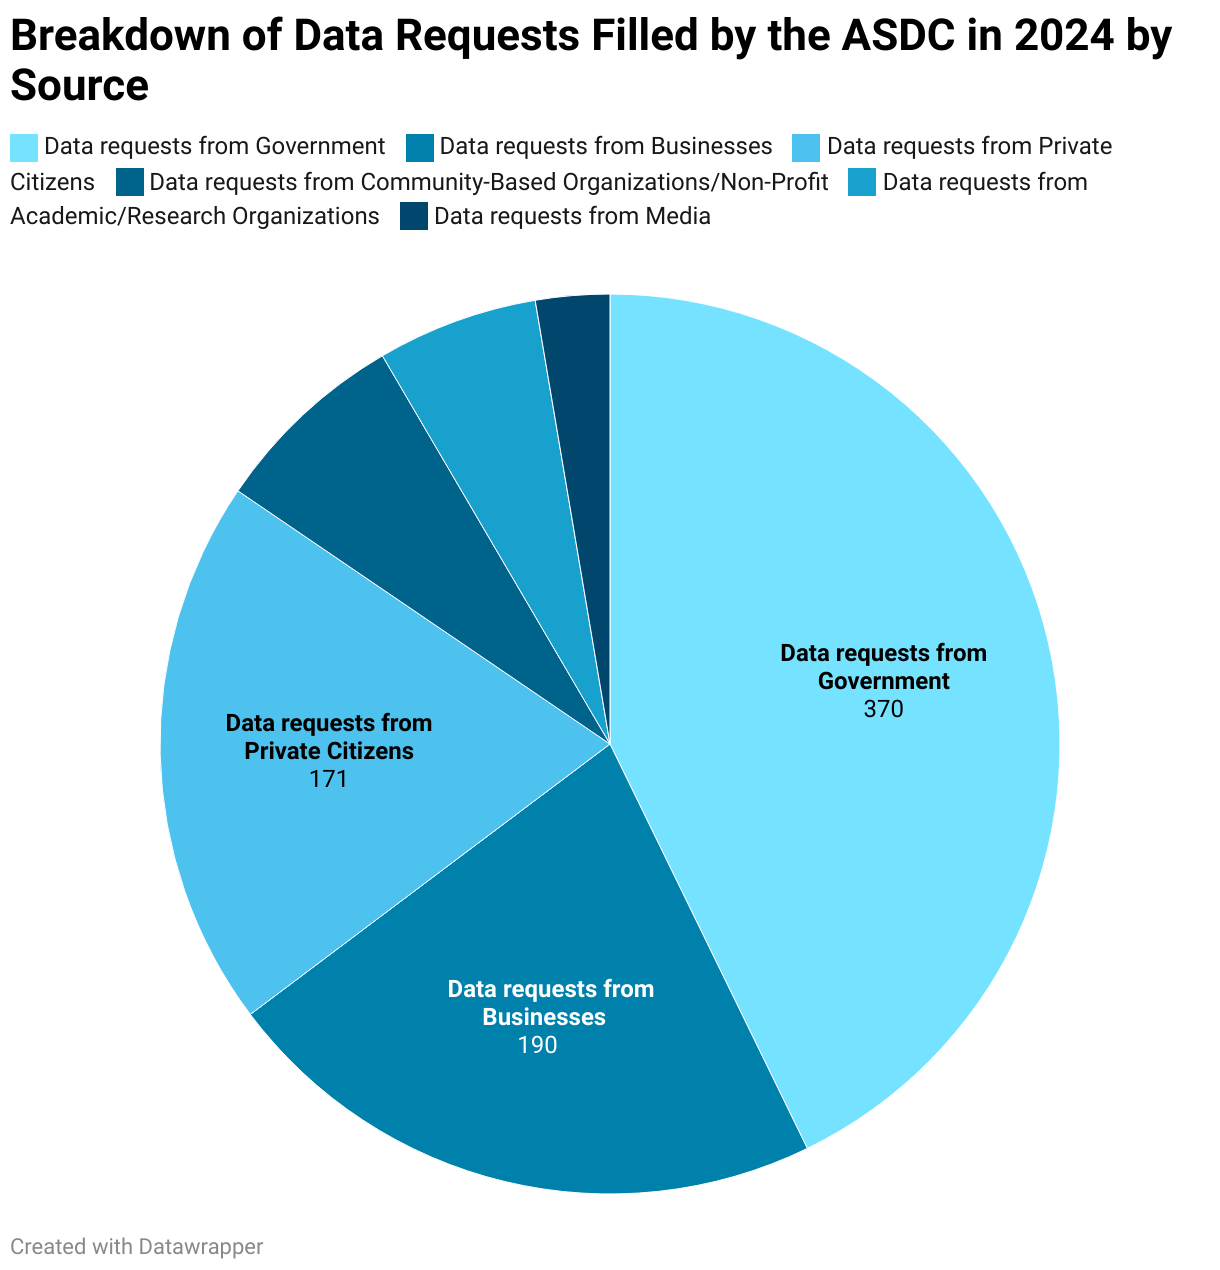
In 2024, the Alabama State Data Center network filled 865 data requests. Of those, 845 were filled free of charge. The chart below shows who the data requests came from broken down into seven main categories. Over a third of 2024’s data requests to the ASDC came from government agencies, but many businesses and private citizens also reached out to affiliates to help access or understand data.
The ASDC was formed in 1978 as a partnership between the U.S. Census Bureau and the State of Alabama. Throughout the years, the technology has changed, but the mission has remained the same: to make data available locally to the public through a network of state agencies, universities, libraries, and regional and local governments and to foster two-way communications with the bureau on data usability and user needs.
One of the most important jobs of an ASDC affiliate is to help people in Alabama access and understand data, so we’ll answer questions, help you find and access data, or connect you with Census Bureau experts for free. Whether you are trying to describe your community so you can better serve them or apply for grants, or if you are interested in learning more about genealogy to understand your own history, or if you want to learn more about the businesses in your community before you embark on your own venture, the Alabama State Data Center can help!
Population can grow in two ways: through a natural increase, which is when births outnumber deaths in an area, or through positive net migration, which is when more people move into an area than out of it.
Overall, the state’s population grew by 40,026 people from July 1, 2023 to July 1, 2024. During that period, Alabama experienced a natural decrease: deaths outnumbered births in the state by 1,732. However, that was significantly offset by positive net migration: 41,791 more people moved into Alabama than out of it. Just over 62 percent (26,028) of those people moved to Alabama from somewhere else in the US, while the remaining 38 percent (15,763) moved from somewhere internationally.[1]
Population Growth by County from 2023 to 2024
Breaking it down into smaller geographies, the population in 34 of Alabama’s 67 counties grew by more than 100 people from July 1, 2023 to July 1, 2024; 20 counties either gained or lost fewer than 100 people; and 14 counties saw population decreases of more than 100 people in from 2023 to 2024.
Six counties had significantly more in-migration than the rest of the counties, with a net migration higher than 1,400 people: Madison, Baldwin, Limestone, Shelby, Tuscaloosa, and St. Clair. Those six counties also had the highest total population growth by raw numbers (see Table 1).
Madison County and Baldwin County had the highest population growth by raw numbers, with their respective populations increasing by 9,464 and 7,501 people over the year. Madison County had 793 more births than deaths, adding to their population growth, but Baldwin County actually had a negative natural change, with 150 more deaths than births from July 1, 2023 to July, 1 2024.
Table 1: Six High-Growth Counties and Alabama Population
Components of Change from 2023 to 2024
Total Population Change
Natural Change (births minus deaths)
Total Net Migration
Alabama
40,026
-1,732
41,791
Madison County
9,464
793
8,680
Baldwin County
7,501
-150
7,645
Limestone County
4,139
175
3,979
Shelby County
3,576
457
3,103
Tuscaloosa County
2,376
703
1,673
St. Clair County
2,008
563
1,426
View detailed table here that includes all 67 counties as well as detailed breakdowns of the components of change. Source: U.S. Census Bureau, Population Division
Population Growth by MSA from 2023 to 2024
Much of the state’s growth from 2023 to 2024 occurred in counties that are part of Alabama’s twelve metropolitan statistical areas (MSAs). The Census Bureau defines the general concept of a metropolitan as that of an urban core area of 50,000 inhabitants or more, together with adjacent counties that have a high degree of economic and social integration with that core.
All of Alabama’s twelve MSAs experienced some population growth from 2023 to 2024, though the scale of that growth ranged from just a few people to several thousands (see Table 2). The Huntsville MSA, which includes Madison and Limestone counties, had the highest population growth, while the Birmingham and Daphne-Fairhope-Foley MSAs also saw significant growth of over 6,000 people.
All of the MSAs had positive net migration while only half experienced natural growth. Birmingham had the third highest net migration of the MSAs and was notably the only one to have higher international net migration (3,751) than domestic (2,205).
Table 2: Alabama MSA Population Components of Change from 2023 to 2024
Metropolitan Statistical Area
Total Population Change
Natural Change
(births minus deaths)
Total Net Migration
Anniston-Oxford
24
-325
350
Auburn-Opelika
3,388
340
3,031
Birmingham
6,382
441
5,956
Daphne-Fairhope-Foley
7,501
-150
7,645
Decatur
691
-228
916
Dothan
1,286
-211
1,496
Florence-Muscle Shoals
1,038
-442
1,486
Gadsden
33
-427
460
Huntsville
13,603
968
12,659
Mobile
594
355
246
Montgomery
1,385
688
697
Tuscaloosa
1,788
436
1,334
View detailed table here that includes detailed breakdowns of the components of change for the MSAs as well as Alabama’s 12 micropolitan statistical areas. Source: U.S. Census Bureau, Population Division
All of the latest population estimates for Alabama as well as its counties, MSAs, cities, and towns can be found in easy-to-use spreadsheets on CBER’s Alabama Demographics page. These data are provided as a free service from the University of Alabama’s Center for Business and Economic Research as part of their role as the lead agency for the Alabama State Data Center (ASDC) and for the Federal State Cooperative for Population Estimates (FSCPE). If you have any questions about this or other local data, please feel free to reach out to CBER’s socioeconomic team: Dr. Nyesha Black (ncblack@ua.edu) or Susannah Robichaux (scrobichaux@ua.edu).
[1] Net international migration for the United States includes the international migration of both U.S.-born and non-U.S.-born populations. Specifically, it includes: (a) the net international migration of the non-U.S. born, (b) the net migration of U.S. born to and from the United States, (c) the net migration between the United States and Puerto Rico, and (d) the net movement of the Armed Forces population between the United States and overseas.
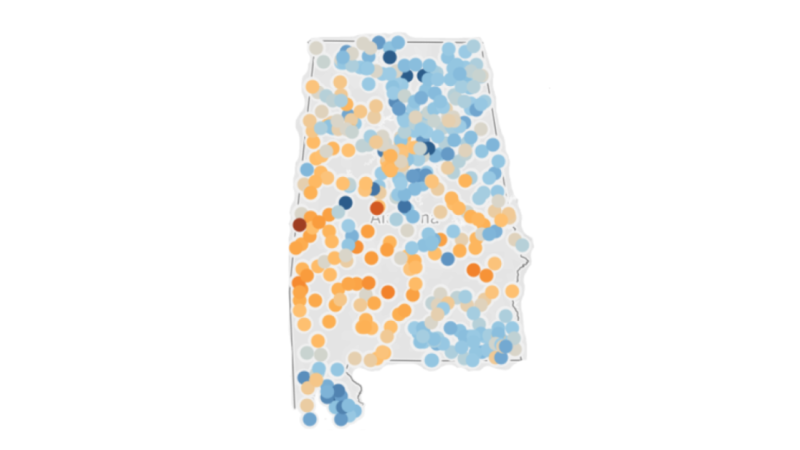
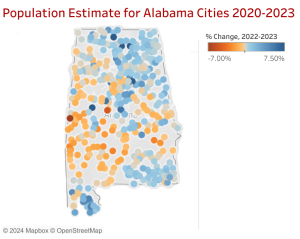
Click here to view the interactive map with the 2023 population data for cities and towns:Data Source: 2023 Population Estimates, U.S. Census Bureau
Map made by Dr. Komla Khoumi
Population Growth
From 2022 to 2023, 259 cities and towns in Alabama experienced some population growth, gaining at least one person. Fifty-one of those places grew by more than 100 people, and six increased their population by more than 1,000 people. Table 1 below has the cities and towns in Alabama with the highest population growth.
Table 1. The top 15 towns and cities in Alabama with the
most population growth from 2022 to 2023.
Population trends in the state’s fifteen largest cities varied: six large cities grew by more than 500 people, with the most growth in Huntsville (3,534), Athens (2,262), and Auburn (1,648). Five of the state’s largest cities grew by less than 400 people, with some population levels only growing modestly. Four of the largest cities lost more than 100 people, with the largest decreases in the cities of Montgomery (-1,657) and Mobile (-695). Table 2 shows the population changes from 2022 to 2023 for Alabama’s largest cities.
Huntsville continued to experience significant growth, adding almost 10 people per day from 2022 to 2023 to reach a population of over 225,000. Huntsville has been Alabama’s most populous city since 2020 and, as of 2023, has almost 30,000 more people than the state’s next largest cities, Birmingham and Montgomery.
Table 2. Population changes in Alabama’s 15 largest
cities from 2022 to 2023.
Fast-growing places are those with a high growth rate in population from 2022 to 2023. Of the fifteen fastest growing cities and towns in Alabama, four were in Baldwin County: Silverhill, Foley, Loxley, and Fairhope. Two other counties also had more than one city rank on as some of the fastest growing places: Triana and Owens Cross Roads are in Madison County, and Odenville and Margaret are in St. Clair County.
Table 3. The top 15 fastest-growing towns and cities in Alabama
from 2022 to 2023.
Some cities in Alabama lost population from 2022 to 2023, according to the latest estimates. Fifteen cities’ populations decreased by more than 100 people from 2022 to 2023. Eight of those cities were in Jefferson County, which you can see marked by an asterisk in Table 4.
Table 3. The 15 Alabama towns and cities with the biggest
population decreases from 2022 to 2023.
Analysis and text by Susannah Robichaux, Socioeconomic Analyst and lead for the Alabama State Data Center. Interactive map by Dr. Komla Koumi, Assistant Research Professional.
Reports for the Q2 2024 Alabama Business Confidence Index Now Available
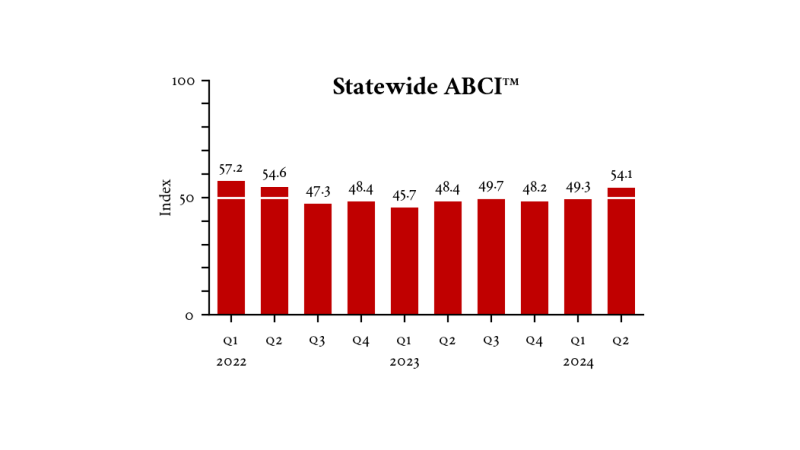
The Alabama Business Confidence Index (ABCI) grew by 4.8 points to reach a mildly confident expansionary index of 54.1 in the Q2 2024 survey. All six component indexes saw increases from their Q1 2024 levels, though the magnitude varied from fairly low increase (2.2 points) to a large leap (9.6 points). Business leaders are forecasting second quarter growth with mild to strong confidence for all of the industry component indexes and the Alabama economy. The only negative index for the quarter is the US outlook, which has been contractionary since Q1 2022.
View the ABCI homepage for more details on the specific components of the statewide ABCI forecast which are also broken down by industry and firm size; or view individual metro reports for Birmingham-Hoover, Huntsville, Mobile, Montgomery, and Huntsville. Historical reports are available for download from the ABCI archive.
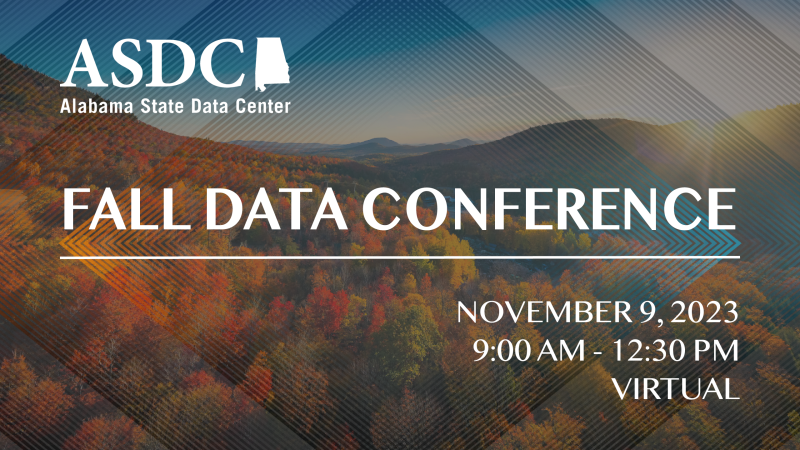
The Alabama State Data Center (ASDC), housed in the University of Alabama’s Center for Business and Economic Research (CBER) hosted its annual Census data conference on Thursday, November 9, 2022 from 9:00am to 12:30pm CST. The free virtual conference included presentations on the latest updates from the Census Bureau’s 2020 urban-rural classification system; the Population Estimates Program; the Economic Census; and the recently published 2020 Census Demographic and Housing Characteristics file.
Click on the red, bold titles below to view the slides for the presentations. For recordings of the webinars, reach out to Susannah Robichaux, CBER socioeconomic analyst and lead for the ASDC, at scrobichaux@ua.edu.
Alabama State Data Center Fall 2023 Conference Thursday, November 9, 2022: 9:00am – 12:30pm
Welcome and Introductions | Susannah Robichaux, ASDC Lead / Socioeconomic Analyst, The University of Alabama’s Center for Business and Economic Research; and Devon Reed, Liaison to the State Data Centers and Census Information Centers, Data Users Branch, U.S. Census Bureau.
Population Estimates from the U.S. Census Bureau| Kevin Barragan-Smith, Demographer/Statistician Coordination, Dissemination, and Outreach Branch, Population Division, U.S. Census Bureau. This presentation was an overview of the Census Bureau’s Population Estimates Program (PEP), which produces population and housing estimates for the United States, its states, counties, cities, and towns. It included some background information about how the estimates are made, what estimates are available, and a detailed walkthrough of how to access estimates. It also gave an introduction to the Population Estimates Challenge Program, which allows governmental units to submit requests to revisit that year’s estimate if they suspect there has been a technical error or incorrect input data. Lastly, it covered the national population projections released by the PEP. As a reminder, CBER produces county population projections that are available on our Alabama Demographics page.
2020 Census Data Products and Disclosure Avoidance | Matthew Spense, Senior Advisor for Special Population Statistics and Disclosure Avoidance, Population Division, U.S. Census Bureau. This webinar was an overview of 2020 data collection, data protection (differential privacy), and the data products released including the Apportionment file, Redistricting data; and the Demographic and Housing Characteristics File (DHC).
Economic Census Updates | Adam P. Grundy, Supervisor, Data User and Trade Outreach Branch, Economic Management Division, U.S. Census Bureau. The Economic Census provides the most comprehensive measure of the U.S. economy, producing industry statistics at the national, state, and local levels. Its data products provide the foundation for other key measures of economic performance. This information is used by businesses, policy makers, local governments, communities, individuals, students, and researchers for economic development, business decisions, strategic planning, and data reports. This presentation will be an overview of the program and the available data products. It also had a detailed walkthrough of how to use the Census Business Builder 5.3.
2020 Urban/Rural & Geography Updates | Byron White, Geographer, Address and Spatial Analysis Branch, Geography Division, U.S. Census Bureau. This presentation offered an overview of the Census Bureau’s urban area criteria; the key changes for the 2020 Census Urban Areas; key 2020 Census Urban Area trends; and what is next for urban areas.
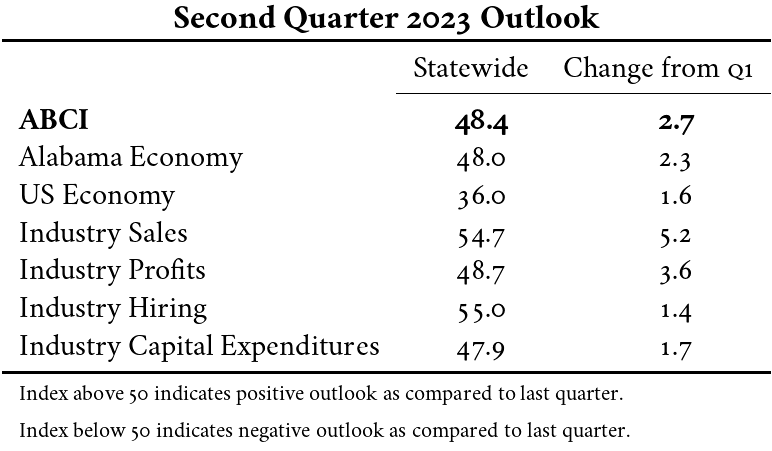
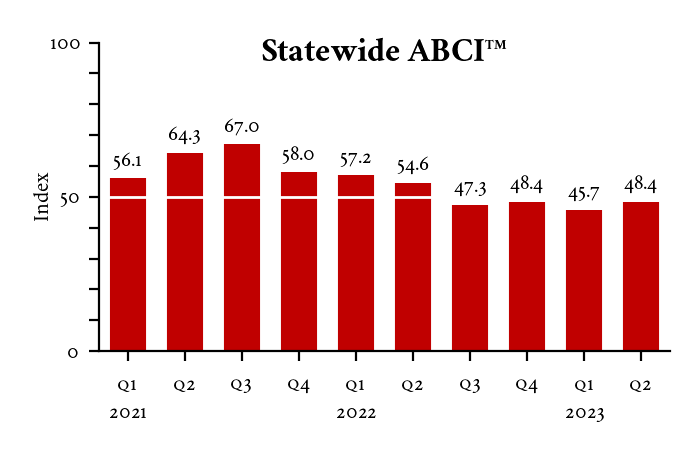
Business leaders throughout Alabama still have an overall mildly negative forecast for Q2 2023, according to the latest Alabama Business Confidence Index (ABCI) survey. This is the fourth consecutive quarter that the index has been negative, though it is slightly less negative than last quarter’s ABCI. Business confidence has been declining since Q4 2021, but interestingly, the highest and lowest component indexes have been consistent these last seven quarters: hiring has been the highest index and is the only index to remain positive the entire time, and the US outlook has been the lowest index, consistently registering more than 10 points below the other indexes.
On the ABCI website, you can view the detailed ABCI metro reports for Birmingham-Hoover, Huntsville, Mobile, Montgomery, and Tuscaloosa; the full statewide report that includes an overview for Alabama and the ABCI broken down by industry and firm size; and access historical data. Read on for an overview.
CBER’s forecasters are anticipating very mild growth in 2023, with a 0.5-percent increase in Alabama GDP for 2023. Though positive, it is a slower rate of GDP growth than seen in 2021 (5.1 percent) and 2022 (1.6 percent). Alabama employment growth is expected to plateau in 2023, only growing by about 0.3 percent. Total tax receipts are forecast to grow by 5.3 percent in FY2023. While this is more growth than predicted for GDP and employment, it is still a notable decrease from last year’s 15.2-percent.
The forecasts from the metro areas ranged from moderately negative to mildly positive in the Q2 2023 survey. Business leaders in Huntsville had the highest ABCI at 52.0, making them the only metro with a positive outlook for the quarter. Mobile was not far behind, though, with a neutral ABCI of 49.6. Tuscaloosa had mild confidence in their negative forecast (45.7), which was tempered by mildly positive forecasts for industry sales and hiring. Montgomery and Birmingham–Hoover had the lowest ABCIs for the quarter at 43.8 and 43.0, respectively, with all of their component indexes registering at or below the neutral 50.
The industry index, which only includes panelists’ forecasts for their own industry sales, profits, hiring, and capital expenditures, ranged from mildly negative to moderately positive in the Q2 2023 survey. In Q2 2023, panelists in professional, scientific, and technical services and construction are continuing to forecast growth with mild confidence, but they are also joined by “All Other Services” and manufacturing, whose indexes grew significantly from Q1 2023 to reach moderately high levels of confidence in their positive outlook.
Though it remained negative, the index for retail trade had the highest increase from last quarter growing 9.4 points from its very negative Q1 2023 index to reach a moderately negative 43.8. Expectations for hiring in retail are positive, but business leaders in the industry are forecasting decreased capital spending with very strong confidence in Q2 2023. The outlook from business leaders in finance, insurance, and real estate was the lowest industry index for the quarter at a moderately negative 42.6. This was the only industry category to have negative forecasts for all of the component indexes.
Though the ABCIs by firm size all remained below 50, there were varied levels of confidence in the forecasts for the component indexes. Midsize firms, those with 20 to 99 employees, had the highest Q2 2023 ABCI which increased 6.8 points to reach an almost neutral 49.5 for the quarter. This comes after three quarters of the midsize ABCI being the lowest industry firm ABCI. Small firms, those with up to 19 employees, had a mildly negative ABCI of 48.8 for the quarter. Large firms had the lowest ABCI of the three groupings at a mildly negative 46.7, which is only 0.1 points above the Q1 2023 large firm ABCI, indicating a continuation of last quarter’s forecasts.
This makes 86 consecutive quarters that the Center for Business and Economic Research in UA’s Culverhouse College of Business has measured sentiment about the economy and industry prospects in the state. If you are a business leader in the state, be sure to do your part by registering to be an ABCI panelist and contributing to this unique forecasting tool in the Q3 2023 survey from June 1-17.
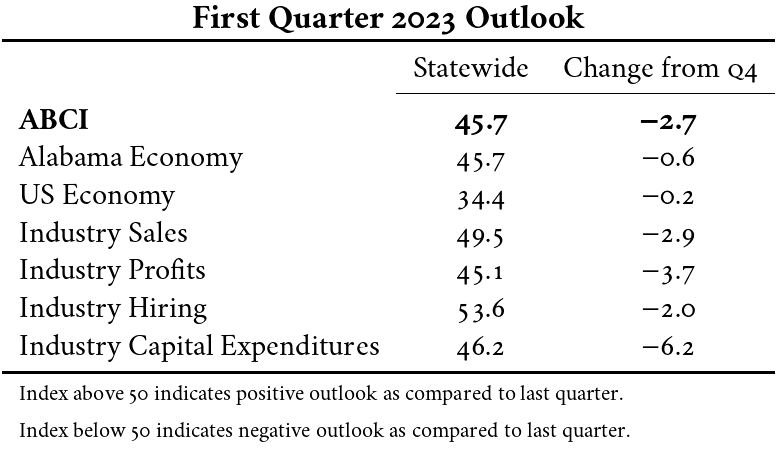
Business confidence throughout the state remained mildly negative in the Q1 2023 Alabama Business Confidence Index (ABCI) survey. With over 60 percent of panelists forecasting worse conditions, the outlook for the US economy was the lowest for the quarter at 34.4. This quarter, the indexes for all of the industry categories fell: industry profits and capital expenditures are expected to decrease with mild confidence while sales are forecast to continue at the same rate as last quarter. Industry hiring was the only positive index for Q1 2023 with a mildly positive index of 53.6, with 34 percent of panelists anticipating an increase in their hiring compared to Q4 2022.
CBER’s forecasters expect very mild growth in 2023. The rebound of Alabama GDP is slowing, with only a 0.1-percent increase expected this year, and employment in the state is forecasted to remain somewhat stable and only decrease by 0.3 percent. Despite that, CBER anticipates significant growth in the Alabama tax receipts due to strong consumer spending.
The ABCIs for Alabama’s metro areas are all below 50 this quarter, but level of confidence in those forecasts varied. Huntsville had the highest ABCI at a mildly negative 47.9, followed closely by Mobile at 47.0. Both metros had moderately confident hiring indexes, which set them apart from the other metros. Tuscaloosa had an ABCI of 45.6, with neutral expectations for sales and hiring. Birmingham-Hoover and Montgomery had the lowest ABCIs of 43.5 and 42.9, respectively. The indexes in these metros were all mildly to strongly negative, with the exception of Montgomery’s mildly positive hiring forecast.
Panelists in professional, scientific, and technical services had the highest industry index at a moderately positive 55.9, with strongly confident expectations for increased sales and hiring compared to the previous quarter. Business leaders in construction are also forecasting increased hiring and sales, though with milder confidence, leading them to be the only other group to have a positive industry index at 52.5. Five of the nine industry groups still have positive expectations for hiring in Q1 2023, but most industries are forecasting decreased profits and capital spending compared to their Q4 2022 levels.
All three firm size groupings had negative ABCIs in the Q1 2023 survey. Midsize firms, those with 20 to 99 employees, had the lowest ABCI at a moderately negative 42.7, while the ABCIs for small firms, those with up to 19 employees, and large firms, those with 100 or more employees, were only mildly negative. This is the third consecutive quarter that the midsize firms have had a lower ABCI than their counterparts. Midsize firms had the lowest values for all of the component indexes in the Q1 2023 survey except hiring, where their moderately positive index of 55.1 was the most confident of all the groupings’ forecasts.
The ABCI is an initiative of the Center for Business and Economic Research located in the Culverhouse College of Business, The University of Alabama. This makes 85 consecutive quarters that the Center for Business and Economic Research in UA’s Culverhouse College of Business has measured sentiment about the economy and industry prospects in the state. Be sure to do your part by contributing to this unique forecasting tool in the Q2 2023 survey on March 1-17. You can view past and current reports by clicking on the buttons above or following this link: https://cber.culverhouse.ua.edu/alabama-business-confidence-index/.