
Alabama Tax Reform- A Little Progressiveness and Some Revenue Too
- August 19th, 2019

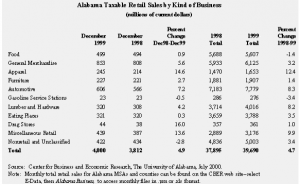
| Alabama Retail Sales, 1998-1999
Alabama retailers rang up taxable sales totaling $4.0 billion in December 1999, a 4.9 percent increase over the $3.81 billion tallied in December 1998. Nationally, monthly retail sales rose 11.0 percent for December 1999 compared to December 1998. In Alabama, December sales gains were strongest in apparel, up 14.6 percent; automotive, which gained 7.2 percent; drug stores, with sales climbing 16.0 percent; and miscellaneous retail, where sales rose 13.6 percent. December 1999 sales at general merchandise stores were 5.6 percent higher than a year ago. For 1999 as a whole, Alabama retailers reported $39.7 billion in sales, up 4.7 percent from 1998. However, Alabama’s annual increase was just over half the national gain of 9.1 percent. Statewide, apparel sales showed the sharpest rise during the year, climbing 12.4 percent. Automotive sector sales posted a gain of 8.3 percent during 1999, while sales of lumber and hardware rose 8.2 percent. The automotive and lumber and hardware sectors were among the U.S. retail sales growth leaders during 1999, with increases of 11.8 and 10.6 percent, respectively. Across Alabama, retail sales in the miscellaneous category were up 9.9 percent in 1999. But sales at eating and drinking places increased a modest 3.5 percent for the year, while general merchandise sales rose just 3.2 percent. Reported food store sales declined by 1.4 percent for 1999 compared to 1998. |
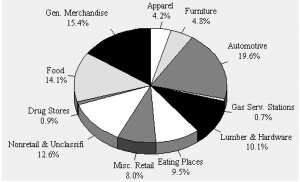
| Alabama’s retail mix shifted slightly during 1999. Strong growth in automotive sales boosted the sector’s share to 19.6 percent of all retail sales, up from 18.9 percent in 1998 and 17.3 percent in 1990. General merchandise stores pulled in 15.4 cents of every dollar spent at retail in Alabama in 1999, while food stores took in 14.1 cents, down from 15 cents in 1998 and 18.4 cents in 1990.
CBER calculates monthly retail sales from reports received by the Alabama Department of Revenue. A periodic disaggregate survey of multi-county firms is administered by the Department of Revenue to collect information needed to allocate sales to individual counties. CBER’s county-level data series is currently based on the 1996 survey. Beginning with January 2000 data, results of a 1999 survey will be incorporated. More frequent disaggregate surveys are planned, enabling a more accurate and continuous county-level retail sales series. State-level retail sales calculations are not affected by disaggregation. Carolyn Trent with assistance from Kathryn Rivers |
|
|
Source: Center for Business and Economic Research, The University of Alabama.
A Look at Medium-Size Alabama City Budgets
| With the current economic expansion providing national and state budget surpluses, how are Alabama cities faring? Where do cities get their money, and how do they use it? Are most city budgets about the same, or are some very different? These questions can be answered by examining city financial reports, but for a state with 444 cities and towns it is a Herculean task. The task is complicated by the uniqueness of each city, which can be seen in differences in geographic location, resources, socio- economic, and demographic factors. However, grouping the cities makes the task somewhat easier. This article looks at Alabama’s medium-size cities—those with 10,000 to 100,000 inhabitants.
Population estimates for Alabama cities and towns in 1998 ranged from seven people in Gantts Quarry to 252,997 in Birmingham. Four cities, Birmingham, Mobile, Montgomery, and Huntsville, had populations of more than 100,000. Forty-nine cities were between 10,000 and 100,000, with nine having populations of more than 30,000. There were 179 cities and towns with populations of 1,000 to 10,000, and 212 towns with less than 1,000 inhabitants. We examined fiscal year 1998 city financial reports for a sample of eleven medium-size cities, using revenue and expenditure classifications for governmental accounting, auditing, and financial reporting. About half of Alabama’s medium-size cities had budget surpluses in 1998. However, those cities with red ink had deficits that were much deeper than the heights of the surpluses of the other cities. These deficits seem to be the result of large capital outlays. Hopefully, even with large capital expenditures, more of our cities will run budget surpluses enabled by the current economic climate. City revenues come from taxes, charges for services, intergovernmental transfers, licenses and permit fees, fines and forfeitures, interest, and miscellaneous revenues. From their revenues, cities make expenditures for public safety, public works, and other social services. There are additional charges for capital projects, debt service, running the government, and miscellaneous charges. Not surprisingly, taxes are the major source of revenues, about 58 percent. License and permit fees are the next major component of revenues, and raise about 15 percent on average. Charges for services and intergovernmental |
transfers bring in about 9 percent each, and the remainder is raised through fines, interest, and miscellaneous income. A word of caution in interpreting these findings is that not all charges for services may be reported; some cities have water and sewer boards whose financial statements are not included in their financial reports. What is interesting is the wide range that the top three components of revenues cover. Taxes range between 41.1 and 70.1 percent; license and permit fees, 8.7 to 19.7 percent; and intergovernmental transfers, 4.6 to 21.0 percent.
Social services average 61 percent of total city expenditures, but the range among cities is from 48 to 81 percent. Running city governments averages 12 percent of expenditures, ranging between 5 and 22 percent. The remaining 27 percent of total expenditure is allocated to capital outlay, debt service, and miscellaneous expenses. Expenditures on other services (health and welfare, culture and recreation, education, and economic and urban development) have the widest range, 3.0 to 44.6 percent. Interestingly, public safety takes up about 25 percent of expenditures, while only 21 percent is spent on health and welfare, culture and recreation, education, and economic and urban development. If communities could reduce crime, perhaps more attention and resources could be devoted to providing good health, schools, libraries, parks, job training, and other quality-of-life services. Alternatively, cities could raise more revenues and devote the additional funds solely to providing social services and raising the quality of life. This look at our medium-size city budgets suggests that if we expect city governments to provide citizens a higher quality of life, the citizenry must expect to pay for it. What is really impressive is that about half of the cities spend less than 10 percent on running city governments. In addition, more than a third spend greater than 70 percent of total expenditures on social services. These are laudable achievements, and for them, kudos to our city governments. About a fifth of the cities spend more than 20 percent on their governments, and another fifth spend less than 50 percent on social services. For these last expenditure shares, we must be concerned. Samuel Addy |
Sample Cities’ Population, Revenues and Expenditures
Fiscal Year 1998
| Population | Total | Total | Excess | ||
| City | 1998 Estimate | Revenues | Expenditures | (Deficit) | |
| 1 | Anniston | 25,524 | $32,892,982 | $31,475,842 | $1,417,140 |
| 2 | Athens | 19,720 | 13,944,106 | 14,064,522 | (120,416) |
| 3 | Cullman | 14,437 | 18,833,149 | 17,670,597 | 1,162,552 |
| 4 | Enterprise | 21,663 | 15,982,949 | 15,650,885 | 332,064 |
| 5 | Eufaula | 13,463 | 10,182,683 | 14,196,135 | (4,013,452) |
| 6 | Northport | 20,247 | 13,926,006 | 13,274,927 | 651,079 |
| 7 | Opelika | 24,490 | 22,704,109 | 29,447,518 | (6,743,409) |
| 8 | Ozark | 12,660 | 9,553,452 | 10,673,317 | (1,119,865) |
| 9 | Phenix City | 27,353 | 17,481,203 | 20,953,443 | (3,472,240) |
| 10 | Prattville | 25,769 | 13,964,588 | 13,491,108 | 473,480 |
| 11 | Selma | 22,037 | 21,752,536 | 20,536,244 | 1,216,292 |
| Sources: FY 1998 city financial reports; U.S. Bureau of the Census; and Center for Business and Economic Research, The University of Alabama. |
Sample Cities’ Detailed Revenues and Expenditures, Fiscal Year 1998
(Percent of Total)
| Note: Sums may not total 100 percent due to rounding.
Sources: FY 1998 city financial reports; Alabama Department of Public Examiners; and Center for Business and Economic Research, The University of Alabama. |
Census of Retail Trade:
Comparative 1992 and 1997 Alabama Retail Trade
| Comparing SIC-based results of the 1992 and the 1997 Census of Retail Trade from the U.S. Census Bureau shows the strength of Alabama’s retail sector. During these five years, Alabama outpaced the nation in overall growth of retail establishments, employees, and sales. According to survey results, Alabama’s landscape was dotted by 25,586 retail businesses in 1997, an increase of over 1,500 since 1992. The state’s 6.3 percent gain in the number of establishments compares to a U.S. gain of 2.3 percent. Retail employment in Alabama grew to 342,835 in 1997. The addition of over 73,000 retail workers between 1992 and 1997 marked a 27.1 percent increase, well above the 15 percent national average increase. Alabama retail sales rose 35.6 percent during this period, slightly above the U.S. gain of 34.4 percent.
Across Alabama, the number of businesses selling new and/or used cars rose to 1,106 in 1997, a 25 percent increase over the 885 car dealers in the state in 1992. The number of eating and drinking establishments jumped by 812 to 6,140, a 15.2 percent gain, while the number of businesses selling furniture, furnishings, and consumer electronics and appliances rose to 2,043, an 11.9 percent increase. Slight declines were reported in the number of food stores, drug stores, and apparel stores. |
Many new Alabama retail employees hired between 1992 and 1997 found themselves working at eating and drinking places, where the number of full- and part-time employees increased by 32,049; or at general merchandise stores, which added 14,203 workers. Sales gains for the period 1992 to 1997 were strongest in the lumber and hardware and automotive sectors, topping 50 percent.
Data from the 1997 economic censuses were the first based on the North American Industry Classification System (NAICS) rather than the Standard Industrial Classification (SIC). To permit comparison with the 1992 economic census, the Census Bureau has released summary state and national statistics for 1997 recalculated using SIC categories. These comparative statistics for all industry categories can be found at on the Internet at www.census.gov/epcd/ec97sic. The Census Bureau’s economic censuses are based on a survey of firms in each industry. Thus, these retail data may differ from retail sales data tabulated by CBER. Carolyn Trent |
Alabama Shows Dramatic Improvement in Education Attainment;
State Remains Below National Average
| Estimates released by the U.S. Census Bureau show Alabama’s educational level improving, and dramatic improvement is shown in those groups who have historically been less educated, the Alabama State Data Center at The University of Alabama reports.
The findings are based on a survey conducted in 1999 and refer to the population 25 years old and over. “Educational attainment is one of the most important influences on economic well-being,” says Annette Jones Watters, assistant director of the Center for Business and Economic Research and manager of the Alabama State Data Center in UA’s Culverhouse College of Commerce and Business Administration. “More education tends to reflect greater socioeconomic success for individuals and for the state.” In 1990, one out of every three Alabama adults did not have as much as a high school education. By 1998 that average had dropped to about one out of five. Alabama’s overall educational level remains below the national average, but it is catching up. The census information showed that significant differences remain with regard to age and race, but the percentages of whites and blacks with a high school education attained a record level in 1999. Among whites in the state, 82 percent were high school graduates or more, compared with the 79 percent recorded for blacks. The black/white educational attainment gap is narrowing as the proportion of black students obtaining a high school degree has increased considerably during the past decade. Over the last 20 years, high school completion among young adults has been higher than during earlier periods of Alabama’s history. During the past decade, the proportion of the young adult population with a bachelor’s degree has also increased, although more modestly. Younger people tend to be better educated than older Alabamians. The educational level of the total adult population will continue to rise for some time, as younger, more educated, age groups replace older, less educated ones. College-educated people are fewer in Alabama than the national average, but the gap is closing. Nearly 22 percent of Alabama adults have a bachelor’s degree or higher, compared to 25 percent nationwide. The South has the lowest educational attainment level of any region of the country. Of the bottom 10 states by percent of high school graduates (California, North Carolina, Tennessee, Arkansas, South Carolina, Louisiana, Texas, Kentucky, Mississippi and West Virginia), only California is not a Southern state. Alabama’s educational attainment level has risen to the point that the state no longer ranks among the last 10 in the nation. Educational attainment and economic well-being are closely linked. Average earnings increase at each progressively higher level of education. For example, in 1998 the national average earnings for people 25 years and older who completed only high school was $25,257. For those with a bachelor’s degree, the average earnings rose to $45, 390. This relationship holds true not only for the entire population but also across each subgroup of gender and race. “It is important for Alabama to continue to increase its educational levels because education brings returns to the state as well as to individuals,” Watters said. “Research and development, innovative business practices, and technology advances are the results of a well-educated population.” High employment levels in well-paying jobs result from increased education levels, she added. “Functions such as product design, market research, engineering, tooling, transportation, and advertising can employ more people — and at higher wages — than some factories that produce tangible goods. Most of these business services jobs require education beyond high school. How well Alabamians are educated will strongly influence both the state’s long-term prosperity and the well-being of its labor force.” The University of Alabama’s business school, founded in 1919, first began offering graduate education in 1923. Its Center for Business and Economic Research was created in 1930, and since that time has engaged in research programs to promote economic development in the state while continuously expanding and refining its broad case of socioeconomic information. This enables it to serve as a reservoir for business, economic and demographic data. |
Educational Attainment of People 18 Years and Over
by Age, Sex, Race, and Hispanic Origin
March, 1999
Alabama
|
Characteristic |
Population |
Percent Completed High School |
Percent |
|
…25 years and over |
2,799,000 |
81.1 |
21.8 |
|
Male |
1,285,000 |
83.9 |
24.2 |
|
Female |
1,514,000 |
78.8 |
19.8 |
|
White |
2,097,000 |
82.0 |
23.4 |
|
Black |
677,000 |
79.2 |
16.9 |
|
Hispanic |
19,000 |
(B) |
(B) |
|
Non-Hispanic White |
2,080 |
81.9 |
23.2 |
(B) Base is too small to show the derived measure.
Note: Noninstitutional population only.Source: U.S. Bureau of the Census, Current Population Survey. Internet release date, Septebmer 15, 2000.
| Hoover Leads Alabama Cities’ Population Gain; Birmingham, Gadsden Post Losses The city of Hoover gained more new residents than any other Alabama city from 1990 to 1999—20,317 people, according U.S. Census Bureau data released by the Alabama State Data Center at The University of Alabama. Annette Watters, center director, said the census data also show that while Birmingham has retained its status as the largest city in the state, Birmingham and Gadsden were also the only two cities in Alabama’s Top 10 list that lost population through the decade. Birmingham lost about 16,480 people during the 1990s and Gadsden lost about 1,370. “Huntsville was a close contender to Hoover in terms of growth,” noted Watters, whose center falls under the direction of the UA College of Commerce and Business Administration and its Center for Business and Economic Research. “Huntsville gained 17,500 people during that time period, going to a population of 160,372. “Madison and Alabaster were also double-digit gainers in the nineties,” she said. “Madison gained 12,490 and Alabaster gained 10,670, in round numbers.” However, Watters explained that a surface glance at the numerical growth doesn’t tell the entire story. While Hoover gained the most people, Helena had the biggest percent increase. Helena went from a mere 4,454 in 1990 to 10,950 in 1999—a 145.8 percent increase. Other cities in the state that have grown by more than half again what they had at the 1990 census are Madison, Millbrook, Alabaster, and Pelham. Hoover, Trussville, Fairhope, and Moody each grew more than 40 percent in nine years time. Watters said, “Population growth of that magnitude puts pressures on the city. Government leaders have to keep up with services and current residents have to make accommodations for new residents. Whether it is a small town that is growing quickly, or a large city that is booming, fast growth usually brings both good and bad news.” Not every prominent Alabama city saw growth in the last decade. Tuskegee, Fairfield, Homewood, Anniston, Prichard, Selma, and Bessemer, in addition to Birmingham and Gadsden, saw noticeable population declines. Watters pointed out that these numbers are estimates for the year 1999. Data from Census 2000 have not yet been released. “When we get the actual population counts in a few months, we’ll have a more accurate idea of how our cities and towns are doing. These population estimates will be used until we have more accurate data from the recently completed census.” The 1999 estimate for every incorporated city or town in Alabama is available from the Alabama State Data Center at UA. The University of Alabama’s Culverhouse College of Commerce and Business Administration, founded in 1919, first began offering graduate education in 1923. Its Center for Business and Economic Research was created in 1930, and since that time has engaged in research programs to promote economic development in the state while continuously expanding and refining its base of socioeconomic information. Ten Largest Cities in Alabama
|
Alabama Exports Up
First Quarter 2000
| During the first quarter of 2000, Alabama exports rose nearly 13.5 percent over the same period in 1999. Most of these were exports to Canada, Mexico, and Austria, with increases of 18.8, 19.4, and 763.9 percent respectively. Transportation equipment, chemical products, paper products, industrial and electrical machinery, and electronics accounted for almost 60 percent of total exports during the first quarter of 2000.
Alabama’s export statistics for 1999 could have been much lower if not for a 437.2 percent increase in exports to Austria. Since 1998, when Mercedes-Benz decided to assemble the M-class vehicle at their plant in Graz, Austria as well as at the Vance, Alabama plant, there has been a phenomenal increase in exports from Alabama to Austria. |
From 1997 to 1998, Alabama exports to Austria increased from $3.8 million to $51 million, an increase of 1243.38 percent. Between 1998 and 1999, these exports increased another 437.16 percent, reaching $273.8 million. As of 1999, Mercedes-Benz is now the state’s largest exporter, sending almost $700 million in vehicles to 135 countries around the world.Another of Alabama’s largest and most consistent trading partners has been Mexico. Like many states, Alabama saw a significant increase in trade with Mexico immediately after the implementation of NAFTA (North American Free Trade Agreement). That country quickly became Alabama’s third largest exports market, growing by nearly 500 percent in just 3 years. By 1997 exports had risen to over $1 billion. Since then, exports to Mexico have declined to about half that amount. Despite this drop, Mexico is expected to be the state’s second largest export market after Canada in 2000. Japan will drop out of second place due to that country’s recession-type economic environment.
Ahmad Ijaz |
Table 1
Total Value of Alabama Exports by Top Ten Countries of Destination
(Millions of Dollars)
| Country | 1997 | 1998 | 1999 | Percent Change 1997 to 1998 |
Percent Change 1998 to 1999 |
| Canada | $1,463.2 | $1,607.6 | $1,688.3 | 9.9 | 5.0 |
| Japan | 683.0 | 703.8 | 684.9 | 3.1 | -2.7 |
| Mexico | 1,012.5 | 622.9 | 550.7 | -38.5 | -12.0 |
| Germany | 183.2 | 524.7 | 503.0 | 186.3 | -4.2 |
| United Kingdom | 396.9 | 357.2 | 387.8 | -1 | 9.0 |
| Austria | 3.8 | 51.0 | 273.8 | 1243.8 | 437.2 |
| Netherlands | 275.9 | 286.2 | 264.2 | -2.8 | -1.5 |
| France | 163.3 | 282.2 | 261.3 | 72.6 | -7.4 |
| Korea, Republic of | 257.9 | 90.0 | 152.8 | -65.1 | 70.0 |
| China (Taiwan) | 82.9 | 54.7 | 138.8 | -34.0 | 153.9 |
| Total for All Countries | $6,702.4 | $7,036.5 | $6,851.5 | 5.0 | -2.6 |
Sources: Massachusetts Institute for Social and Economic Research (MISER)
and State of Alabama Foreign Trade Relations Commission.
Table 2
Total Value of Alabama Exports by Top Five Industry Sectors
(Millions of Dollars)
| Industry | 1997 | 1998 | 1999 | Percent Change 1997 to 1998 |
Percent Change 1998 to 1999 |
| Transportation Equipment | $1,463.2 | $1,607.6 | $1,688.3 | 261.6 | 14.9 |
| Chemicals and Allied Products | 683.0 | 703.8 | 684.9 | 8.7 | -5.7 |
| Paper and Allied Products | 1,012.5 | 622.9 | 550.7 | -13.7 | -13.0 |
| Industrial Machinery and Computer Equipment |
183.2 | 524.7 | 503.0 | -13.4 | -4.1 |
| Electronic and Electrical Equipment |
396.9 | 357.2 | 387.8 | -51.3 | -19.7 |
| Total for All Industries | 6,702.4 | $7,036.5 | $6,851.5 | 5.0 | -2.6 |
|
Sources: Massachusetts Institute for Social and Economic Research (MISER) and State of Alabama Foreign Trade Relations Commission. |
|||||
Table 3
Total Value of Alabama Exports by Top Five Industry Sectors and Top Five Countries
Millions of Dollars, First Quarter 1999 to First Quarter 2000
| Country | Quarter 1 1999 |
Quarter 1 2000 |
Percent Change 99Q1 to 00Q1 |
| Canada | $ 418.8 | $ 497.5 | 18.8 |
| Japan | 185.2 | 181.6 | -2.0 |
| Mexico | 139.2 | 166.1 | 19.4 |
| Austria | 15.3 | 132.7 | 763.9 |
| United Kingdom | 103.0 | 87.7 | -14.9 |
| Total for All Countries | $1,674.5 | $1,899.9 | 13.5 |
| Industry | |||
| Transportation Equipment | $ 379.6 | $ 348.4 | -8.2 |
| Chemicals and Allied Products | 223.3 | 278.0 | 24.5 |
| Paper and Allied Products | 141.1 | 188.9 | 33.9 |
| Industrial Machinery and Computer Equipment |
150.7 | 187.3 | 24.2 |
| Electronic and Electrical Equipment |
106.9 | 148.5 | 38.8 |
| Total for All Industries | $1,674.5 | $1,899.9 | 13.5 |
| Sources: Massachusetts Institute for Social and Economic Research (MISER) and State of Alabama Foreign Trade Relations Commission. |
|||
| Where Are the Jobs for Young People?Summer is over. Students are back in school. Vacations are fading memories. Teen-agers’ participation in the labor force crests and recedes with the seasons, but teen-agers are always part of the Alabama work scene.
The youth labor market has recently captured the public’s attention for several reasons. Governments and businesses are interested in the transition from school to work. Teachers and counselors study the “job shopping” process through which youths settle into stable career employment. Labor market analysts are interested in the consequences of youth unemployment and racial differences in youth unemployment. Economists have analyzed the implications of statutory minimum wages. What are some of the findings from these studies? High School Students. High school students tend to work more hours the older they are. That is, an 18-year-old student with a job might work close to 22 hours a week, whereas a 16-year-old might work only about 16 hours a week. This rise with age occurs among both males and females. The seasonal variation in high school student employment within the calendar year is even more dramatic than the between-age-group trend. Employment activity rises sharply during the summer months and drops off during the school year. This within-year rise in employment during the summer weeks occurs at all ages for both males and females, although male students are more likely to be employed and to work more hours per week when they are employed. The academic calendar is not the only factor driving summer employment by high schoolers. Seasonal shifts in labor demand also contribute. High school students tend to work at occupations and in industries that have busy summer seasons. Fully one-fifth of employed high school students work in food service, usually as servers, buspersons, dishwashers, cooks, and so on. The other leading occupations employing high school students include stock handlers (primarily in grocery stores), sales clerks, and recreation and amusement workers. Most high school students working in private households appear to be babysitters. High School Dropouts. In sharp contrast to the pattern for high school students, the employment activity of young high school dropouts exhibits little seasonal variation. The large summer increase in high school student employment does not make much difference in the employment of high school dropouts. There is, however, a very large difference in employment rates between male and female high school dropouts. In a typical week, roughly two-thirds of male dropouts are employed while only about one-third of female dropouts have a job. Moreover, employed male dropouts work three to seven hours more per week than employed female dropouts. The employment difference between male and female dropouts is much greater than the male-female difference between students. In fact, female dropouts are even less likely to be working than female students. Among those who are working, however, female dropouts work more hours per week than do female students. Are dropouts working in the same jobs as similarly-aged students? By far the most common occupation for dropouts is food service worker—the same as for high school students. But there are also differences between the two groups. Dropouts don’t concentrate their jobs as intensely in a few sectors of the economy as do students. For example, there is a bigger percentage of dropouts than students working as cleaning service workers and a much smaller percentage working in private households. Implications for Alabama Business. The Alabama Commerce Commission recently reported that the tourism industry provides the State of Alabama with one of its best returns on investment and recommended pursuing additional major attractions within the state. Youth workers will provide an important source of labor supply for an enhanced tourism industry. Young people have a history of success at jobs in entertainment, recreation services, eating places, and retail establishments. The retail sector of Alabama’s economy has been a growth engine in recent years. If retailing continues to prosper, it will continue to rely on young workers to be sales workers, cashiers, and stock persons. Young workers don’t always have a long employment tenure with their employers. They move on to other stages of their lives. The hope is that the work experiences they have as teen-agers will contribute positively to their futures. An entry-level job can instill a strong work ethic, give a young person a career direction, and teach many lessons not gained in the classroom. Alabama needs its youth workers, and young people need Alabama businesses. Annette Jones Watters Excerpted in part from Gerald S. Oettinger, “Seasonal and Sectoral Patterns in Youth Employment,” Monthly Labor Review, p. 6-11, U. S. Department of Labor, Bureau of Labor Statistics. |