Category: Uncategorized

Migration is the Primary Driver of Alabama’s Uneven Growth: Findings from U.S. Census Vintage 2020–2025 Estimates

  • April 24th, 2026

Click here to download a PDF of the full report.

Alabama’s total population grew by 167,651 residents between April 1, 2020 and July 1, 2025, reaching 5,193,088. Annual growth peaked during 2023–2024 at 0.88 percent, with a comparable growth rate of 0.81 percent between 2022 and 2023. Migration, particularly domestic migration, reflecting residents relocating to Alabama from other states, has been the primary driver of population growth throughout the period.

The most recent year reveals emerging demographic headwinds. A broad national slowdown in international migration has also affected Alabama, with international migrants declining from 15,763 in 2023–2024 to 8,946 in 2024–2025, which is a drop of 6,817 migrants, or 43.7 percent. This sharp contraction in international migration contributed to downward population pressure in the state’s most recent estimate period, tempering what had been an accelerating growth trajectory.

Despite this recent deceleration in population growth, Alabama’s five-year growth trend remains solid, exceeding the national average. However, growth is uneven and is concentrated in a handful of metropolitan areas.

Figure 1. Alabama Total Population, April 2020–July 2025

A line graph of Alabama's total population growth from April 2020 to July 2025. The line is trending upwards.
Source: U.S. Census Vintage 2025 Population Estimates, analysis conducted by CBER.


Alabama’s Population Growth Compared to Other States

Alabama’s 3.34 percent cumulative growth rate between 2020 and 2025 exceeded the national rate of 3.10 percent but ranked ninth among the Census-defined region of the South, which comprises 16 south-eastern states and the District of Columbia. This region grew at 5.98 percent — nearly double Alabama’s pace — led by Florida (8.93%), South Carolina (8.83%), and Texas (8.78%), each sustained by high and consistent in-migration flows.

No comparison better illustrates Alabama’s relative rank than South Carolina. In 2010, Alabama’s population of 4,779,736 exceeded South Carolina’s 4,625,364 by 154,372 residents. By the 2020 Census, the two states populations diverged, and by July 2025, South Carolina’s population surpassed Alabama’s population by 377,186 residents, having grown at a rate more than two-and-a-half times faster over the 2020–2025 period.

Yet Alabama’s trajectory remains positive. Despite the widening gap with South Carolina, the state consistently added residents each year — a distinction not shared by Mississippi, Louisiana, and West Virginia, the only Southern states to record population losses since 2020.

Figure 2. Alabama Outpaces the Nation but Trails Most Southern Peers in Population Growth, 2020–2025

A bar graph of population growth rates from the Census Southern States from 2020 to 2025.
Source: U.S. Census Vintage 2025 Population Estimates, analysis conducted by CBER.


Figure 3 plots each U.S. state by its natural change rate (horizontal axis) and net migration rate (vertical axis) between 2020 and 2025, revealing the two demographic forces driving — or constraining — population change across the country. Southern states and the District of Columbia are labeled; the remaining states appear as unlabeled grey dots.

Alabama, distinguished in black, sits in the upper-left quadrant: natural decrease paired with positive net in-migration. Between 2020 and 2025, Alabama recorded 303,445 births against 331,008 deaths — a natural decrease of 27,563 residents. Net migration of 195,050 more than offset that loss, producing the state’s overall net gain of 167,651 residents. Domestic migrants accounted for 141,048 of that total, or 72.3 percent, with international migrants contributing the remaining 54,002. Alabama’s population dynamics are shared by several Southern states, including Florida, South Carolina, Tennessee, Delaware, Kentucky, and Arkansas, where deaths now outpace births, but in-migration more than compensates for the downward pressure of relatively high death rates on overall population change.

Alabama fared better than Louisiana, where the state’s population dynamics are the inverse of Alabama’s dynamics, in which there were more births than deaths, but net negative migration. In comparison, similar to Alabama, Mississippi and West Virginia experienced natural decrease; however, in-migration was too modest to compensate for the excess deaths over births, resulting in cumulative population decline over the period.

Figure 3. Migration Is Key to Population Growth in Alabama and Across Most U.S. States, 2020–2025

A scatter graph of population growth rates in the U.S. from 2020 to 2025 with net migration rate plotted against the natural change rate.
Source: U.S. Census Vintage 2025 Population Estimates, analysis conducted by CBER.


Population Growth by County

Alabama’s statewide growth obscures dramatic heterogeneity across its 67 counties. In absolute terms, Madison County led all counties with a net gain of 45,358 residents between 2020 and 2025, followed by Baldwin (35,983), Limestone (19,365), Lee (15,544), and Shelby (15,521). These five counties alone accounted for 131,771 residents — nearly 79 percent of Alabama’s entire statewide net population gain of 167,651, underscoring the geographic concentration of the state’s population growth.

In contrast, Jefferson County recorded the largest numerical loss at −8,588 residents, followed by Dallas (−3,325), Mobile (−3,154), and Montgomery (−3,062) counties. Alone, these four counties accounted for nearly 11 percent of all county-level population losses recorded over the period. Among Alabama’s 67 counties, 34, or just over half of all counties, recorded net population losses between 2020 and 2025, even as the statewide total continued to grow.

Figure 4. Numeric Population Change Across Alabama’s 67 Counties, 2020–2025

A bar graph of Alabama counties' population growth from 2020 to 2025.
Source: U.S. Census Vintage 2025 Population Estimates, analysis conducted by CBER.


Across Alabama’s 67 counties, Figure 5 shows that the rate of population change ranges from nearly 19 percent growth to nearly a 13 percent decline — a 32-percentage-point spread that captures the magnitude of the state’s demographic divide.

Limestone County reported the highest growth rate at 18.7 percent, which is nearly five times the statewide rate of 3.3 percent, reflecting rapid in-migration. Baldwin (15.5%) and Madison (11.7%) round out the top three, each driven by strong and sustained domestic in-migration. Of the 67 counties, 33 grew faster than the statewide rate of 3.3 percent, while 34 grew more slowly or recorded outright population losses from 2020 to 2025.

Among counties with the steepest rate of decline, most are in Alabama’s Black Belt region. Perry (−12.8%) and Lowndes (−9.3%) recorded the steepest losses in the state. Figure 5 also illustrates significant proportional decline among small, rural counties. For example, Macon (−7.2%), Greene (−8.6%), Dallas (−8.6%), and Wilcox (−8.8%) each recorded population losses representing a substantial share of their relatively small 2020 base populations. Conecuh (−6.0%), Choctaw (−6.0%), and Sumter (−6.1%) also recorded notable declines.

Figure 5. Rate of Population Change Across Alabama’s 67 Counties, 2020–2025

Bar graph of Alabama counties rate of change from 2020 to 2025.
Source: U.S. Census Vintage 2025 Population Estimates, analysis conducted by CBER.


Figure 6 illustrates all 67 Alabama counties by their natural change rate (horizontal axis) and net migration rate (vertical axis) between 2020 and 2025, highlighting the two demographic forces shaping population change at the county level. The quadrant structure organizes counties into four distinct demographic profiles based on the direction of each force.

Nine counties sit in the upper-right quadrant, recording both positive natural increase and net in-migration —dual population growth forces. Limestone, Madison, and Lee counties anchor this group, each benefiting from younger age structures and relatively high in-migration flows. The upper-left quadrant is the modal category, which consists of counties with a demographic profile similar to the state, where natural decrease (more deaths than births) offset by sufficient in-migration to yield net population gains.

All the counties in the lower-left quadrant experienced both natural decrease and net out-migration.  Montgomery stands alone in the lower-right quadrant — the only county, in Alabama, that had natural increase alongside net out-migration.

Figure 6. Most Alabama Counties Experience Natural Decrease, but Migration is the key to Population Growth, 2020-2025

A scatter graph of Alabama county population growth rates in the U.S. from 2020 to 2025 with net migration rate plotted against the natural change rate.
Source: U.S. Census Vintage 2025 Population Estimates, analysis conducted by CBER.


Figure 7 tracks shifts in county population rankings across Alabama’s 67 counties between April 2020 and July 2025, with black lines indicating counties that rose in rank, red lines indicating counties that fell, and grey lines indicating counties whose population rank remained unchanged over the period.

Henry County recorded the most dramatic upward rank of any county, climbing four positions from the 51st largest county to the 47th largest. Limestone and Autauga each rose two positions, while Randolph and Cleburne also gained two ranks — all reflecting sustained in-migration over the period. Jefferson, Baldwin, Morgan, Lee, and 28 other counties held their rankings entirely unchanged from 2020 to 2025.

The sharpest declines belong to Russell and Macon, each falling three positions, followed by Montgomery and Dallas, which each dropped by two ranks. Montgomery’s fall from 5th to 7th is notable, given that it is the only county in the state with a natural increase, but negative net migration. Mobile dropped one position, falling from 2nd to 3rd as Madison County’s rapid growth pushed it to now be the state’s second largest county.

Figure 7. Shifts in Alabama County Population Rankings, 2020–2025

A graph that shows the change in rankings in Alabama Population from 2020 to 2025.
Source: U.S. Census Vintage 2025 Population Estimates, analysis conducted by CBER.


Population Growth by MSA

Figure 8 shows that Huntsville MSA recorded the largest absolute gain of any Alabama metro at 64,723 residents, or a growth rate of 13.2 percent. The Huntsville MSA only consists of two counties (Madison and Limestone), and it is the second largest MSA in the state with a total population at 556,444 residents. The Daphne-Fairhope-Foley MSA reported the highest growth rate at 15.5 percent, adding 35,983 residents, and has a population estimate of 267,761.

Birmingham, Alabama’s largest MSA, spans six counties, and has a population of nearly 1.2 million, but only added 17,134 residents — a modest 1.5 percent gain relative to the size of the metro.

The growth of the Birmingham MSA is largely driven by the growth of two counties in the MSA– Shelby and St. Clair. Auburn-Opelika (7.3 percent) and Tuscaloosa (4.5 percent) also recorded solid growth, driven in part by the presence of large and growing state universities.

The Mobile MSA had the largest population loss among all the metros, losing 3,154 residents, or a decline of 0.8 percent. Anniston-Oxford also loss population, falling by 605 residents (-0.5 percent). The Montgomery MSA, which includes four counties, recorded marginal growth of just 2,697 residents, or 0.7 percent, with Autauga and Elmore counties driving the MSA’s growth.

Figure 8. Total Population and Population Change among Alabama’s 12 Metropolitan Statistical Areas, 2020–2025

Source: U.S. Census Vintage 2025 Population Estimates, analysis conducted by CBER.


Figure 9 reveals that the Daphne-Fairhope-Foley MSA recorded the highest net migration rate among all Alabama metros despite having more deaths than births. The Huntsville MSA recorded the second-highest net migration rate and sits in the upper-right quadrant, and it is one of four metros that recorded both positive natural increase and positive net in-migration from 2020 to 2025. Florence-Muscle Shoals, Dothan, and Decatur cluster in the upper-left quadrant with modest positive migration rates offsetting natural decrease.

The Mobile MSA is the only metro in the lower-right quadrant, with more deaths than births paired with net out-migration. Anniston-Oxford, also shown in red, has more people moving into the MSA than out, but it sits just slightly above the migration axis, and the MSA’s steep rate of natural decrease, results in cumulative population loss over the five-year period.

Figure 9. Natural Change Rate and Net Migration Rate, Alabama Metropolitan Statistical Areas, 2020–2025

A scatterplot showing the Alabama MSA natural change rate and net migration rate from 2020 to 2025.
Source: U.S. Census Vintage 2025 Population Estimates, analysis conducted by CBER.


Conclusion

In summary, this analysis unravels a consistent story about Alabama’s demographic trajectory between 2020 and 2025. The state grew by 167,651 residents and outpaced the national average, but that growth was not evenly distributed as more than half of Alabama’s 67 counties loss population over the period, and natural decrease (more deaths than births) was the norm across many counties and metropolitan areas. Migration was the key engine of statewide population gain, concentrated in a small number of high-growth counties and selected metropolitan areas that benefited from high rates of domestic in-migration.


Analysis and text by Nyesha Black, Ph.D., Director of Demographics and Socioeconomic Analysis at CBER.



ASDC Network Answers 865 Data Requests in 2024

  • May 12th, 2025

The University of Alabama’s Center for Business and Economic Research is the lead Alabama State Data Center (ASDC) organization, but the network also includes some amazing affiliates with a wide range of expertise. Each year, we compile a report detailing all of the work being done throughout the state on behalf of the network. This year, twelve affiliates responded, and the numbers are really impressive!

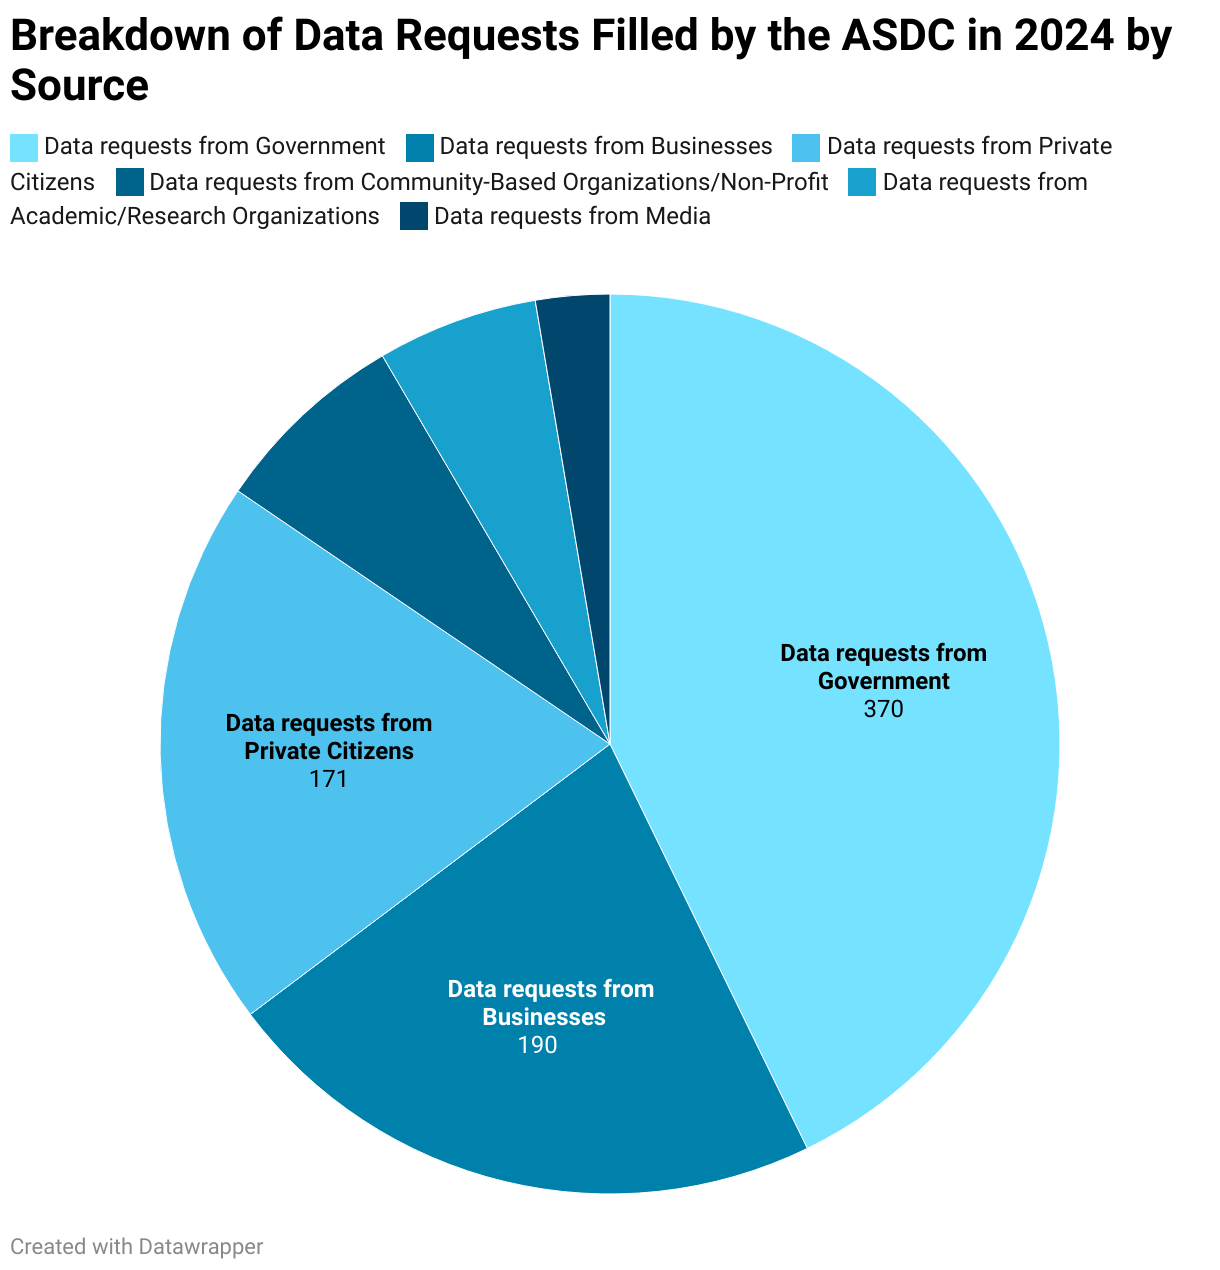
In 2024, the Alabama State Data Center network filled 865 data requests. Of those, 845 were filled free of charge. The chart below shows who the data requests came from broken down into seven main categories. Over a third of 2024’s data requests to the ASDC came from government agencies, but many businesses and private citizens also reached out to affiliates to help access or understand data.

The ASDC was formed in 1978 as a partnership between the U.S. Census Bureau and the State of Alabama. Throughout the years, the technology has changed, but the mission has remained the same: to make data available locally to the public through a network of state agencies, universities, libraries, and regional and local governments and to foster two-way communications with the bureau on data usability and user needs.

One of the most important jobs of an ASDC affiliate is to help people in Alabama access and understand data, so we’ll answer questions, help you find and access data, or connect you with Census Bureau experts for free. Whether you are trying to describe your community so you can better serve them or apply for grants, or if you are interested in learning more about genealogy to understand your own history, or if you want to learn more about the businesses in your community before you embark on your own venture, the Alabama State Data Center can help!

2023 Population Estimates for Alabama Cities and Towns

  • May 22nd, 2024

The U.S. Census Bureau released updated population estimates last week for Alabama’s 462 incorporated cities and towns. The new data estimates the population on July 1, 2023 using birth, death, and migration statistics, and revises the estimates for 2022, 2021, and 2020. These new estimates, along with other useful data, can be found on the Alabama Demographics page on the website of the Center for Business and Economic Research at The University of Alabama.


Click here to view the interactive map with the 2023 population data for cities and towns:
Data Source:  2023 Population Estimates, U.S. Census Bureau
Map made by Dr. Komla Khoumi


Population Growth

From 2022 to 2023, 259 cities and towns in Alabama experienced some population growth, gaining at least one person. Fifty-one of those places grew by more than 100 people, and six increased their population by more than 1,000 people. Table 1 below has the cities and towns in Alabama with the highest population growth.


Table 1. The top 15 towns and cities in Alabama with the
most population growth from 2022 to 2023.
    Change from 2022 to 2023
Place 2023 Population Estimate Number Percent
Huntsville city 225,564 3,534 1.6%
Athens city 30,904 2,262 7.9%
Auburn city 82,025 1,648 2.1%
Foley city 24,873 1,180 5.0%
Fairhope city 24,974 1,108 4.6%
Madison city 60,854 1,063 1.8%
Opelika city 33,572 801 2.4%
Tuscaloosa city 111,338 763 0.7%
Florence city 42,437 750 1.8%
Daphne city 30,321 654 2.2%
Cullman city 19,913 648 3.4%
Gulf Shores city 16,850 569 3.5%
Prattville city 39,318 564 1.5%
Silverhill town 1,923 558 40.9%
Chelsea city 16,771 556 3.4%

Source: 2023 Population Estimates, U.S. Census Bureau Population Estimates Program.


Alabama’s Largest Cities

Population trends in the state’s fifteen largest cities varied: six large cities grew by more than 500 people, with the most growth in Huntsville (3,534), Athens (2,262), and Auburn (1,648).  Five of the state’s largest cities grew by less than 400 people, with some population levels only growing modestly. Four of the largest cities lost more than 100 people, with the largest decreases in the cities of Montgomery (-1,657) and Mobile (-695). Table 2 shows the population changes from 2022 to 2023 for Alabama’s largest cities.

Huntsville continued to experience significant growth, adding almost 10 people per day from 2022 to 2023 to reach a population of over 225,000. Huntsville has been Alabama’s most populous city since 2020 and, as of 2023, has almost 30,000 more people than the state’s next largest cities, Birmingham and Montgomery.

Table 2. Population changes in Alabama’s 15 largest
cities from 2022 to 2023.
    Change from 2022 to 2023
Place 2023 Population Estimate Number Percent
Huntsville city 225,564 3,534 1.6%
Birmingham city 196,644 -243 -0.1%
Montgomery city 195,287 -1,657 -0.8%
Mobile city 182,595 -695 -0.4%
Tuscaloosa city 111,338 763 0.7%
Hoover city 92,448 42 0.0%
Auburn city 82,025 1,648 2.1%
Dothan city 71,258 47 0.1%
Madison city 60,854 1,063 1.8%
Decatur city 58,321 392 0.7%
Florence city 42,437 750 1.8%
Prattville city 39,318 564 1.5%
Phenix City city 38,441 152 0.4%
Vestavia Hills city 38,020 -266 -0.7%
Alabaster city 34,107 238 0.7%

Source: 2023 Population Estimates, U.S. Census Bureau Population Estimates Program.


Fast Growing Populations

Fast-growing places are those with a high growth rate in population from 2022 to 2023. Of the fifteen fastest growing cities and towns in Alabama, four were in Baldwin County: Silverhill, Foley, Loxley, and Fairhope. Two other counties also had more than one city rank on as some of the fastest growing places: Triana and Owens Cross Roads are in Madison County, and Odenville and Margaret are in St. Clair County.


Table 3. The top 15 fastest-growing towns and cities in Alabama
from 2022 to 2023.
    Change from 2022 to 2023
Place 2023 Population Estimate Number Percent
Silverhill town 1,923 558 40.9%
Triana town 4,456 505 12.8%
Owens Cross Roads 2,917 265 10.0%
Athens city 30,904 2,262 7.9%
Odenville city 5,352 380 7.6%
Moundville town 3,516 245 7.5%
Margaret town 6,236 424 7.3%
Oak Grove town 592 40 7.2%
Rehobeth town 2,013 121 6.4%
Jemison city 2,941 164 5.9%
Vance town 2,263 124 5.8%
West Jefferson town 466 24 5.4%
Foley city 24,873 1,180 5.0%
Loxley town 4,623 218 4.9%
Fairhope city 24,974 1,108 4.6%

Source: 2023 Population Estimates, U.S. Census Bureau Population Estimates Program.


Population Loss

Some cities in Alabama lost population from 2022 to 2023, according to the latest estimates. Fifteen cities’ populations decreased by more than 100 people from 2022 to 2023. Eight of those cities were in Jefferson County, which you can see marked by an asterisk in Table 4.

Table 3. The 15 Alabama towns and cities with the biggest
population decreases from 2022 to 2023.
    Change from 2022 to 2023
Place 2023 Population Estimate Number Percent
Montgomery city 195,287 -1,657 -0.8%
Mobile city 182,595 -695 -0.4%
Selma city 16,666 -341 -2.0%
Vestavia Hills city* 38,020 -266 -0.7%
Bessemer city* 25,037 -251 -1.0%
Birmingham city* 196,644 -243 -0.1%
Mountain Brook* 21,737 -204 -0.9%
Center Point city* 15,705 -175 -1.1%
Hueytown city* 16,202 -154 -0.9%
Alexander City city 14,470 -150 -1.0%
Brent city 2,659 -142 -5.1%
Wetumpka city 7,218 -141 -1.9%
Greenville city 7,030 -135 -1.9%
Gardendale city* 16,096 -117 -0.7%
Fairfield city* 9,582 -107 -1.1%

Source: 2023 Population Estimates, U.S. Census Bureau Population Estimates Program.


Analysis and text by Susannah Robichaux, Socioeconomic Analyst and lead for the Alabama State Data Center. Interactive map by Dr. Komla Koumi, Assistant Research Professional.


ALABAMA HOUSING AFFORDABILITY CONTINUES TO SET RECORDS, ACCORDING TO UA CENTER

  • August 7th, 2019

ALABAMA HOUSING AFFORDABILITY CONTINUES TO SET RECORDS,
ACCORDING TO UA CENTER


For the third consecutive quarter the Alabama Housing Affordability Index set a record high, according to the Alabama Real Estate Research and Education Center at The University of Alabama.In the second quarter of this year the AHAI increased to 179.2, the highest the Index has been since the Center began calculating housing affordability in 1992. This new record tops previous highs set in the last quarter of 2000 and the first quarter of 2001.

The statewide housing affordability index is calculated as the ratio of the state’s actual median family income to the income needed to purchase and finance the state’s median priced home. An index number of 100 means that a family earning the state’s median income of $46,056 has just enough buying power to qualify for a mortgage loan on the state’s median priced, single-family home. The higher the index number, the more affordable the housing.

An index number of 179 means that Alabama families earning the statewide median income had more than 1.75 times the income needed to qualify for conventional financing of the statewide median priced home, which in the second quarter was $99,196. Households earning the statewide median income of $46,052 could afford to buy a home priced as high as $177,556 using conventional financing, a 20 percent down payment and a 30-year term.

At the national level, housing affordability actually fell during the second quarter of the year, declining to 138.2 from 142.9 in the first quarter. In large part the decline in nationwide housing affordability was due to the sharp increase in the national median home price to $147,067 in the second quarter; a $7,367 increase over the first quarter median price of $139,700.

According to Dr. Leonard Zumpano, director of the Center, a combination of lower mortgage interest rates and a small decline in the statewide median home price explain the increase in housing affordability for Alabama.

The median price for existing, single-family homes in the second quarter was $99,196, representing a decline of $1,949 from the first quarter of the year, Zumpano said. The average residential mortgage loan rate used in the computation of the housing affordability index was 7.14 percent, down 6 basis points during the first quarter of 2001.

Within Alabama, housing affordability fell in 6 of the state’s 11 metropolitan areas, while rising in Auburn/Opelika, Decatur, Dothan, Florence, and Tuscaloosa. “These are the same metro areas that experienced a fall in median home prices during the second quarter,” Zumpano said.

“Huntsville still leads all the other state metro areas in housing affordability with an HAI of 222. The metro area with the lowest housing affordability continues to be the Mobile area, which largely reflects the impact of Baldwin County’s very high median home price. At $145,833 in the second quarter, Baldwin County had the highest existing home prices within the state. This, in turn, largely reflects the impact of the very strong market for recreational and vacation homes in the county.”

Zumpano said that at the national level, the economy continued to erode during the second quarter, even bringing down the housing sector, which up until now had remained very strong despite the sagging economy. In Alabama, however, the housing market continues to be robust in most metro locations, he said. “In large part, this reflects the fact that unemployment has remained relatively low within the state’s major metro areas, and the Alabama economy has remained strong.”

Zumpano said a large number of economists and market analysts seem to believe that the sluggish economy has just about bottomed out and the second half of the year will see a slight rebound in economic activity.

“If this is the case, look for the housing sector to finish the year on an up note, “he said. “However, the risks to the housing market are mounting. If the U.S economy continues to soften and unemployment, which has been largely confined to the high-tech sector, continues to rise, this could spill over into the housing sector.

“On the plus side this could induce the Fed Reserve to reduce interest rates yet again. Mortgage interest rates have continued to decline since the end of the second quarter and if housing prices moderate over the coming months, this will represent a major buying opportunity for consumers contemplating the purchase of a home.”

The Alabama Real Estate Research and Education Center is part of The University of Alabama’s Culverhouse College of Commerce and Business Administration. The UA business school, founded in 1919, has been recognized repeatedly during the 1990s for offering a high-quality, cost-effective education.