
Alabama Metropolitan Areas- Brighter Days Ahead
- August 19th, 2019

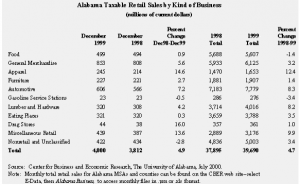
| Alabama Retail Sales, 1998-1999
Alabama retailers rang up taxable sales totaling $4.0 billion in December 1999, a 4.9 percent increase over the $3.81 billion tallied in December 1998. Nationally, monthly retail sales rose 11.0 percent for December 1999 compared to December 1998. In Alabama, December sales gains were strongest in apparel, up 14.6 percent; automotive, which gained 7.2 percent; drug stores, with sales climbing 16.0 percent; and miscellaneous retail, where sales rose 13.6 percent. December 1999 sales at general merchandise stores were 5.6 percent higher than a year ago. For 1999 as a whole, Alabama retailers reported $39.7 billion in sales, up 4.7 percent from 1998. However, Alabama’s annual increase was just over half the national gain of 9.1 percent. Statewide, apparel sales showed the sharpest rise during the year, climbing 12.4 percent. Automotive sector sales posted a gain of 8.3 percent during 1999, while sales of lumber and hardware rose 8.2 percent. The automotive and lumber and hardware sectors were among the U.S. retail sales growth leaders during 1999, with increases of 11.8 and 10.6 percent, respectively. Across Alabama, retail sales in the miscellaneous category were up 9.9 percent in 1999. But sales at eating and drinking places increased a modest 3.5 percent for the year, while general merchandise sales rose just 3.2 percent. Reported food store sales declined by 1.4 percent for 1999 compared to 1998. |
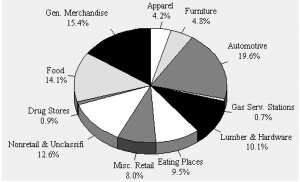
| Alabama’s retail mix shifted slightly during 1999. Strong growth in automotive sales boosted the sector’s share to 19.6 percent of all retail sales, up from 18.9 percent in 1998 and 17.3 percent in 1990. General merchandise stores pulled in 15.4 cents of every dollar spent at retail in Alabama in 1999, while food stores took in 14.1 cents, down from 15 cents in 1998 and 18.4 cents in 1990.
CBER calculates monthly retail sales from reports received by the Alabama Department of Revenue. A periodic disaggregate survey of multi-county firms is administered by the Department of Revenue to collect information needed to allocate sales to individual counties. CBER’s county-level data series is currently based on the 1996 survey. Beginning with January 2000 data, results of a 1999 survey will be incorporated. More frequent disaggregate surveys are planned, enabling a more accurate and continuous county-level retail sales series. State-level retail sales calculations are not affected by disaggregation. Carolyn Trent with assistance from Kathryn Rivers |
|
|
Source: Center for Business and Economic Research, The University of Alabama.
A Look at Medium-Size Alabama City Budgets
| With the current economic expansion providing national and state budget surpluses, how are Alabama cities faring? Where do cities get their money, and how do they use it? Are most city budgets about the same, or are some very different? These questions can be answered by examining city financial reports, but for a state with 444 cities and towns it is a Herculean task. The task is complicated by the uniqueness of each city, which can be seen in differences in geographic location, resources, socio- economic, and demographic factors. However, grouping the cities makes the task somewhat easier. This article looks at Alabama’s medium-size cities—those with 10,000 to 100,000 inhabitants.
Population estimates for Alabama cities and towns in 1998 ranged from seven people in Gantts Quarry to 252,997 in Birmingham. Four cities, Birmingham, Mobile, Montgomery, and Huntsville, had populations of more than 100,000. Forty-nine cities were between 10,000 and 100,000, with nine having populations of more than 30,000. There were 179 cities and towns with populations of 1,000 to 10,000, and 212 towns with less than 1,000 inhabitants. We examined fiscal year 1998 city financial reports for a sample of eleven medium-size cities, using revenue and expenditure classifications for governmental accounting, auditing, and financial reporting. About half of Alabama’s medium-size cities had budget surpluses in 1998. However, those cities with red ink had deficits that were much deeper than the heights of the surpluses of the other cities. These deficits seem to be the result of large capital outlays. Hopefully, even with large capital expenditures, more of our cities will run budget surpluses enabled by the current economic climate. City revenues come from taxes, charges for services, intergovernmental transfers, licenses and permit fees, fines and forfeitures, interest, and miscellaneous revenues. From their revenues, cities make expenditures for public safety, public works, and other social services. There are additional charges for capital projects, debt service, running the government, and miscellaneous charges. Not surprisingly, taxes are the major source of revenues, about 58 percent. License and permit fees are the next major component of revenues, and raise about 15 percent on average. Charges for services and intergovernmental |
transfers bring in about 9 percent each, and the remainder is raised through fines, interest, and miscellaneous income. A word of caution in interpreting these findings is that not all charges for services may be reported; some cities have water and sewer boards whose financial statements are not included in their financial reports. What is interesting is the wide range that the top three components of revenues cover. Taxes range between 41.1 and 70.1 percent; license and permit fees, 8.7 to 19.7 percent; and intergovernmental transfers, 4.6 to 21.0 percent.
Social services average 61 percent of total city expenditures, but the range among cities is from 48 to 81 percent. Running city governments averages 12 percent of expenditures, ranging between 5 and 22 percent. The remaining 27 percent of total expenditure is allocated to capital outlay, debt service, and miscellaneous expenses. Expenditures on other services (health and welfare, culture and recreation, education, and economic and urban development) have the widest range, 3.0 to 44.6 percent. Interestingly, public safety takes up about 25 percent of expenditures, while only 21 percent is spent on health and welfare, culture and recreation, education, and economic and urban development. If communities could reduce crime, perhaps more attention and resources could be devoted to providing good health, schools, libraries, parks, job training, and other quality-of-life services. Alternatively, cities could raise more revenues and devote the additional funds solely to providing social services and raising the quality of life. This look at our medium-size city budgets suggests that if we expect city governments to provide citizens a higher quality of life, the citizenry must expect to pay for it. What is really impressive is that about half of the cities spend less than 10 percent on running city governments. In addition, more than a third spend greater than 70 percent of total expenditures on social services. These are laudable achievements, and for them, kudos to our city governments. About a fifth of the cities spend more than 20 percent on their governments, and another fifth spend less than 50 percent on social services. For these last expenditure shares, we must be concerned. Samuel Addy |
Sample Cities’ Population, Revenues and Expenditures
Fiscal Year 1998
| Population | Total | Total | Excess | ||
| City | 1998 Estimate | Revenues | Expenditures | (Deficit) | |
| 1 | Anniston | 25,524 | $32,892,982 | $31,475,842 | $1,417,140 |
| 2 | Athens | 19,720 | 13,944,106 | 14,064,522 | (120,416) |
| 3 | Cullman | 14,437 | 18,833,149 | 17,670,597 | 1,162,552 |
| 4 | Enterprise | 21,663 | 15,982,949 | 15,650,885 | 332,064 |
| 5 | Eufaula | 13,463 | 10,182,683 | 14,196,135 | (4,013,452) |
| 6 | Northport | 20,247 | 13,926,006 | 13,274,927 | 651,079 |
| 7 | Opelika | 24,490 | 22,704,109 | 29,447,518 | (6,743,409) |
| 8 | Ozark | 12,660 | 9,553,452 | 10,673,317 | (1,119,865) |
| 9 | Phenix City | 27,353 | 17,481,203 | 20,953,443 | (3,472,240) |
| 10 | Prattville | 25,769 | 13,964,588 | 13,491,108 | 473,480 |
| 11 | Selma | 22,037 | 21,752,536 | 20,536,244 | 1,216,292 |
| Sources: FY 1998 city financial reports; U.S. Bureau of the Census; and Center for Business and Economic Research, The University of Alabama. |
Sample Cities’ Detailed Revenues and Expenditures, Fiscal Year 1998
(Percent of Total)
| Note: Sums may not total 100 percent due to rounding.
Sources: FY 1998 city financial reports; Alabama Department of Public Examiners; and Center for Business and Economic Research, The University of Alabama. |