
Who Pays for Cutting Smog-Causing Emissions?
- July 26th, 2019
Who Pays for Cutting Smog-Causing Emissions?
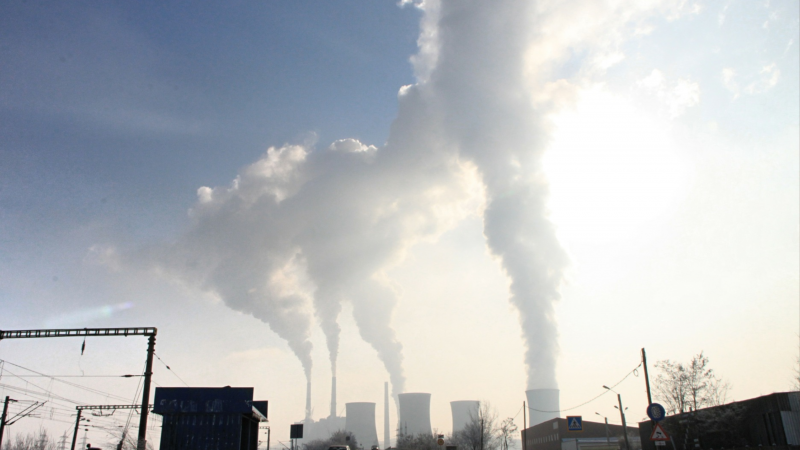
| On September 24, 1998 the U.S. Environmental Protection Agency ordered 22 states east of the Mississippi to reduce smog-causing emissions in a move to halt wind-borne air pollution in the Northeast. The order requires states to have a clean-air plan in place by September of this year and controls by 2003. The move is expected to prevent thousands of cases each year of smog-related illnesses such as bronchitis and exacerbated cases of childhood asthma. Nitrogen oxides, referred to collectively as NOx, are the main smog-causing pollutants. The EPA order requires that by 2003 the 22 states (actually 21 states, since Rhode Island does not have to reduce its emissions) reduce their NOx emissions by a total of 1.16 million tons annually from 1997 levels. See page 4 for the specific list of states and their required reductions.Large, fossil-fuel burning power plants and automobiles are the major sources of NOx emissions. The EPA estimates that it will cost $1,500 per ton of NOx reduction by utilities, compared to $3,400 per ton by automobiles. Thus, the EPA advocates focusing on power plants and estimates that the reduction can be achieved by adding $1 to the average consumer’s bill. Some industry and state environmental officials disagree. They distrust EPA’s estimates regarding wind-borne smog traveling to the Northeast and EPA’s estimate of the pollution-reducing cost per electricity consumer. These concerns raise the question: Who pays for NOx reduction to benefit only the Northeast? In other words, does the EPA Order burden the states equitably?
Trendline analyses between states’ required NOx reductions and selected economic and demographic data reveal several interesting facts. |
On cursory inspection it would seem that states with larger populations are being required to reduce more; however, the percentage reduction is independent of population size. States with lower per capita income are being required to reduce more, in both amount of and percent reduction, so that the poor are being asked to bear a greater burden. States that use more electricity are required to reduce more emissions, making the EPA Order seem fair. However, states that generate and export electricity have an even higher burden.Although automobile NOx emission reduction is more costly, some experts advocate placing the burden on the driver who is using the road and causing the smog. But automobiles are not the main focus of the EPA Order. Electricity is being targeted, even though it is not fair to burden every electricity consumer equally, when the benefits are primarily for one section of the country.
What does all this mean for Alabama? Alabama’s low per capita income indicates a lower ability to afford clean air and health benefits for our northeastern sisters, even if we are willing to pay for that. Alabama is also a net exporter of electricity—a factor for which the state should receive credits rather than blame. Thus, the state is being targeted unfairly to bear the cost of benefits to the Northeast. Alabama has local emissions problems to deal with. The air in some of our own counties is not clean. Adopting emissions controls on vehicles would help alleviate the local pollution. And, we are also required, somehow, to help pay for cleaning the air in the Northeast. Samuel N. Addy |
States Required to Reduce Smop-Causing Emissions
|
Nitrogen Oxide Emissions |
||||||
|
to be Cut by the Year 2003 |
||||||
|
Percent |
Electricity, 1997 |
Miles of |
Federal, Public, |
|||
|
Reduction from |
Use |
Generation |
and Interstate |
Per Capita |
||
|
STATE |
Tons |
1997 Levels |
(million KWh) |
(million KWh) |
Road, 1995 |
Income, 1997 |
| Alabama | 59,934 | 27 | 73,410 | 113,684 | 117,714 | $20,599 |
| Connecticut | 3,234 | 7 | 28,377 | 13,228 | 26,569 | 35,954 |
| Delaware | 2,413 | 12 | 10,025 | 6,579 | 7,110 | 28,443 |
| Georgia | 63,158 | 26 | 100,400 | 101,780 | 142,671 | 23,893 |
| Illinois | 100,965 | 32 | 125,882 | 131,138 | 173,627 | 27,927 |
| Indiana | 114,169 | 36 | 88,400 | 110,466 | 116,053 | 23,183 |
| Kentucky | 75,298 | 33 | 75,748 | 91,558 | 88,143 | 20,599 |
| Maryland | 21,182 | 23 | 56,481 | 44,553 | 37,586 | 28,571 |
| Massachusetts | 1,647 | 2 | 47,543 | 33,899 | 42,013 | 31,207 |
| Michigan | 88,842 | 30 | 97,029 | 89,565 | 151,991 | 24,998 |
| Missouri | 60,556 | 35 | 65,268 | 71,073 | 154,148 | 23,723 |
| New Jersey | 9,961 | 9 | 66,495 | 23,761 | 45,498 | 32,233 |
| New York | 10,590 | 6 | 131,602 | 108,099 | 139,775 | 30,299 |
| North Carolina | 61,449 | 29 | 108,439 | 107,371 | 118,159 | 23,174 |
| Ohio | 132,728 | 36 | 156,606 | 141,249 | 144,019 | 24,203 |
| Pennsylvania | 79,338 | 24 | 126,512 | 177,167 | 147,396 | 25,578 |
| Rhode Island | – | – | 6,680 | 3,563 | 7,547 | 25,589 |
| South Carolina | 29,281 | 21 | 67,798 | 78,374 | 82,414 | 20,551 |
| Tennessee | 69,950 | 28 | 86,001 | 93,293 | 103,428 | 22,752 |
| Virginia | 35,331 | 18 | 87,242 | 58,986 | 91,340 | 26,172 |
| West Virginia | 97,967 | 51 | 26,224 | 88,284 | 45,920 | 18,734 |
| Wisconsin | 38,851 | 27 | 59,943 | 48,560 | 139,776 | 24,199 |
Sources: U.S. Department of Commerce, Bureau of Economic Analysis; U.S. Department of Energy, Energy Information Administration; U.S.
Department of Transportation, Federal Highway Administration; and Environmental Protection Agency.